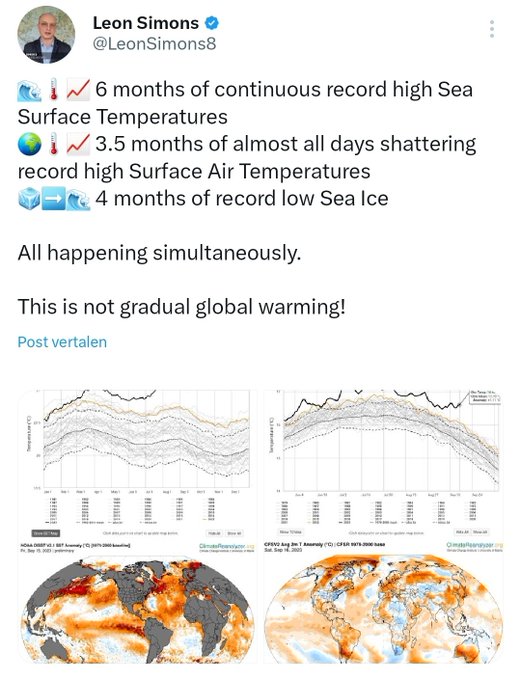
Plain climate science & communication.
Mission: To understand & protect the home planet.
Innovation, energy & health entrepreneur.
Board Club of Rome NL
This might be the year everything changes, as those who don't count joules and radiative fluxes are too starting to feel the heat from reducing air-pollution.
Many great scientists have tried to inform on this in the past decades (e.g. James Hansen, James Lovelock, Paul Crutzen…
It cannot be re-stated enough that
@LeonSimons8
has been the primary scientific voice pushing the narrative about the impacts of reduced sulfate aerosols on ocean temperatures. I'm grateful to see his tireless efforts finally being discussed by scientists and global media.
Please don't kill peaceful protesters for blocking your vehicle!
You don't have to stay calm, but assault is illegal.
Protesters don't like that they have to do this either.
But they are desperate because nothing really worked the past 40 years.
😳WHAT THE F*CK😳
Normally I don't swear, but this is totally crazy.
Global temperature is 0.9°C higher than normal.
This is the highest anomaly ever and we are about 1.5 month away from the annual global peak surface air temperature.
🔥📈BREAKING
@NASA
📈🔥
The Earth Energy Imbalance from NASA satellite data broke through 1.8 W/m² (12-month mean)!
This is faster than I expeced.
More than many experts thought possible.
I called this the most important graph in the world.
A lot more heat is accumulating!
🔥🌍📈BREAKING
@NASA
📈🌍🔥
The Earth's Energy Imbalance from NASA satellite data reached 1.97 W/m² (12-month mean)!!
I called this the most important graph in the world.
This helps to explain all the records currently being broken around the word!
1/
This is so crazy.
The Northern Hemisphere used to radiate more heat to space than it absorbed from the sun.
The difference was made up for by heat transported north from the Southern Hemisphere through (mainly the Atlantic) oceans and atmosphere.
Around 2014 the amount of…
This total madness happening to the 40,000,000 km² of the North Atlantic Ocean surface is getting worse, as we expected.
Many are still in denial.
But we are all finding out together as we go.
All monthly records are being broken simultaneously.
🌍🌡📈June surface air temperatures will be highest on record.
🌊🌡📈Global Sea Surface Temperatures will be record high.
🧊➡️🌊Global Sea Ice will be record low.
This is not normal!
BREAKING!
NASA data shows our Earth is heating at unprecedented speed: 1.64 W/m²
Another 12-month EEI record (from Mar21-Feb22). That's a lot of additional energy in the Earth's system, available to heat oceans, land and atmosphere, melt ice and increase sea levels.
1/
Last month I almost died.
7 years and a day after my brother died in a traffic accident, I was almost run over by a car reversing full speed while I walked behind it.
I got very angry.
Was told to "calm down".
Sometimes we shouldn't be told to calm down.
@bethanyshondark
Ambulances have these lights and sirens with which they can make protesters aware of their presence.
Protesters could let the ambulance go and save that life.
🌎🌡📈
ΔT +2.06 °C !!
This is what uncharted territory looks like.
The first time that the global temperature anomaly has broken through +2.0 °C, for a single day in observational history.
Much more to come in the months ahead.
Provisional ERA5 global temperature for 17th November from
@CopernicusECMWF
was 1.17°C above 1991-2020 - the warmest on record.
Our best estimate is that this was the first day when global temperature was more than 2°C above 1850-1900 (or pre-industrial) levels, at 2.06°C.
As scientists, we are increasingly being asked to tell the public the truth about the crises we face in simple and direct terms. The truth is that we are shocked by the ferocity of the extreme weather events in 2023. We are afraid of the uncharted territory that we have now…
😳What the f*ck😳
Sometimes I can't help myself and swear.
Two months ago, I thought I'd do something ridiculous and plot the Super El Niño trend of 2015 forward for Sea Surface Temperatures, see dashed lines in red (2023) and green (2024).
I turns out that we are largely…
🌊🔥THIS IS NOT F*CKING FINE 🔥🌊
either.
Like the:
🌊🌡📈Record Sea Surface Temperatures
🌍🌡📈 Record high air temperatures
🧊➡️💧Record low sea ice extent.
All happening globally the same days.
What was quite clear to some the past 3 years, is now clear for all to see.😔
We need to learn to live in this +1.5°C climate.
And prepare for a lot more warming in the pipeline.
Because after decades of warnings, the only emissions that are being reduced are those that were hiding much of the warming.
Monthly Temperature anomalies from pre-industrial:
Why is 2023 so F*cking hot?
Because our planet is now absorbing 2.2 W/m² more heat from the sun than it did the first decade of this century.
And because the extra greenhouse gases keep most of that additional heat on Earth.
This is the most important graph in the world:
Yesterday was the first day CO₂ at Mauna Loa was 425 ppm. This is:
-likely the first time in the past 800,000 years.
-possibly not seen in over 3 million years (mid-pliocene warm period).
-A CO₂ forcing equal to 2.5-4°C of warming and 5-25 meters higher global sea level.
@bethanyshondark
The driver almost killed one or two people in this video, and you are making up some fairy tale for the protesters to be guilty of involuntary manslaughter?
This video brings out a lot of strange responses..
Today I was asked why I don't join in blocking traffic to demand more climate action, knowing what I know.
I just don't feel like I could compete with this:
Net-zero CO₂ by 2050 is possible if:
-8,500 coal plants stop burning coal.
-we stop heating homes.
-we stop driving the 1.4 billion cars in the world.
-planes stop flying 100,000 times a day.
-we stop eating tens of billions of animals per year.
-we stop shipping stuff.
The most important graph in the world.
Two years ago NASA showed the world that the rate of global heat uptake had doubled since 2005.
It barely made the news.
🔥📈BREAKING
@NASA
📈🔥
The Earth Energy Imbalance from NASA satellite data broke through 1.8 W/m² (12-month mean)!
This is faster than I expeced.
More than many experts thought possible.
I called this the most important graph in the world.
A lot more heat is accumulating!
The crazy Sea Surface Temperatures of the North Atlantic Ocean quire an extended y-axis yet again.
It's getting harder and harder to find words to describe how crazy this really is.
It's internal variability, they said.
It will go back down within weeks, they said.
Talking about increased warming from desulphurisation promotes geoengineering and inaction, they said.
It's just El Niño, they said.
People need to be accurately informed about risks!
Last month I almost died.
7 years and a day after my brother died in a traffic accident, I was almost run over by a car reversing full speed while I walked behind it.
I got very angry.
Was told to "calm down".
Sometimes we shouldn't be told to calm down.
June was crazy, July will likely be worse:
🌍🌡📈Surface air temperatures highest on record.
🌊🌡📈Global Sea Surface Temperatures highest.
🧊➡️🌊Global Sea Ice lowest.
For all days of July so far, with large margins:
🌎📉🌍
I did some basic energy and water calculations on the scary AMOC study (1) that's making headlines, so you don't have to.
It's quite simple, so please don't let the orders of magnitude scare you off.
This is a Big F*cking Deal (BFD)!
First, what are we talking about…
Breaking News!
March came in at 1.68°C above the 1850-1900 pre-industrial baseline, making it the 10th consecutive month at an all time recorded high, and the 9th consecutive month breaking the Paris limit of 1.5°C.
☀️📈BREAKING
@NASA
CERES🌡️📈
Why was 2023 so extreme? The data is finally in!
The world absorbed a lot more sunlight, as less was reflected.
While greenhouse gases kept most of the additional heat in.
Add El Niño and all temperature records shattered!
More 👇🧵
😳 Absorbed Solar from
@NASA
📈
The amount of solar radiation Earth absorbs is now over 2 W/m² higher than from 2000-2009!
It's hard to explain how much heat this represents.
This is the most important graph in the world!
👇
I hate to say I told you so, but we've been trying to inform the world about the acceleration of global warming for a while now.
Call it an aerosol termination shock.
Call it paying the devil his due when the sulphur clears.
The next 6 months will be shocking!
Global warming acceleration can be traced to decreased aerosols. Full payment in our Faustian bargain is coming due. Looks like our children and grandchildren will be stuck with the tab. Sorry. See July Update:
#ClimateChange
#GlobalWarming
Global Sea Surface Temperature Anomaly keeps rapidly breaking new records.
We need to seriously consider the possibility that this warming spike will be worse than the 1997 and 2015 Super El Niños.
This will turn into record atmospheric heat soon.
🌊🌡️📈
8 months ago, many thought that the record high Sea Surface Temperature anomalies over the 40 million square kilometers of the North Atlantic would be temporary.
After 355 record days and counting, this is not temporary:
🌊🌡️📈
After 348 record high days, the North Atlantic Ocean has reached the same temp anomaly as when this graph went viral around the world last year.
It was long expected, but mostly ignored.
This can help reduce the largest climate uncertainty!
🧵 1/
Historically, this is the time of the year we should really start to see the effects of El Niño on global Sea Surface Temperatures.
But there is no historic precedence of what's happening now.
Do people understand how crazy it is that these records are being shattered SIMULTANEOUSLY and CONTINUESLY for months?
If the extreme weather around the world is shocking to you now, hold onto your hats.
2023 is just a warm-up.
🌊🌡📈 6 months of continuous record high Sea Surface Temperatures
🌍🌡📈 3.5 months of almost all days shattering record high Surface Air Temperatures
🧊➡️🌊 4 months of record low Sea Ice
All happening simultaneously.
This is not gradual global warming!
Has this ever happened before?
🌊🌡️📈Record high Sea Surface Temperatures
🌍🌡️📈Record high global air temperatures
🧊➡️🌊Record low global sea-ice extent
All happening for the same day, May 23rd 2023.
Normally heat flows around the planet and not all records break at once..
👇😳 🇦🇶
📉🧊➡️🌊
It really looks like the Antartic sea ice melting season has started with a million km² of sea ice below the previous record low!
If this low is maintained for the next 5 months, there is about 400 W/m² of solar radiation available to heat the oceans instead…
For those needing a reminder that 365 days of continuous record shattering of an ocean area covering 40 million square kilometers doesn't usually happen, see this:
🌊🌡️📈
The North Atlantic Ocean reached 365 days of continuous record high temperatures!
Thank you to the journalists who have accurately reported on this!
E.g:
Scientists warn Earth warming faster than expected — due to reduction in ship pollution
The Day After Tomorrow seems to have come to Munich today.
❄️✈️ 🇩🇪
When and how will we know if the Atlantic Meridional Overturning Circulation (AMOC) has shut down?
🌍🌊🌡️📈🔥
Not entirely unexpected, still beyond extreme.
Global Sea Surface Temperature Anomaly reaches new record daily high of 0.77°C above 1982-2011 mean.
El Niño is starting to show itself amongst natural variability, long term GHG warming and a sulphur termination shock.
For those still blaming El Niño for the current global record heatwave, please note that its effects are just getting started.
Starting Super El Niño years 1997 and 2015 didn't show any noticeable global surface temperature anomaly for June-July.
This year however..
😳😱
This
@NASA
CERES data is making me very anxious.
The Northern Hemisphere used to radiate more heat to space than it absorbed from the sun.
Not anymore.
This causes very rapid warming of the NH, where 7 out 8 billion people live and grow their food!
We better prepare!
😳 Absorbed Solar from
@NASA
📈
The amount of solar radiation Earth absorbs is now over 2 W/m² higher than from 2000-2009!
It's hard to explain how much heat this represents.
This is the most important graph in the world!
👇
☀️The sun is brighter than for over 23 years.
This contributes to all the temperature high and sea ice low records being broken.
🌍🌡️📈 🌊🌡️📈 🧊➡️🌊
Bring in the human caused climate change deniers, it's the sun!
But don't get too exited. The current average (global,…
🌍🌡📈
After the hottest day and week, we are now experiencing the hottest month "ever" (in about 120,000 years, based on paleoclimatology).
As we keep warming the planet, we will soon experience global temperatures not seen in the past million years!
The most terrible doomer of all is
@EliotJacobson
:
-He uses reliable data sources.
-Which he accurately analyzes and presents.
-He is honest and open about his methods and corrects mistakes.
- Media around the world use his visualizations.
-Large institutions update theirs…
🌊🌡📈
If people only understood how much heat this rapid ocean surface warming represents..
We have to prepare for a lot more extreme weather in the Northern Hemisphere Mid Latitudes, where many of us live.
This just keeps going up!
Northern Hemisphere Surface Air Temperature is now +1.48°C above the 1979-2000 mean.
The 1979-2000 NH mean temp is already about 0.6°C higher than 1850-1900.
So it looks like the Northern Hemisphere is running well above +2°C!
🌡️☀️BREAKING☀️🌡️
Record sunshine and heat and over 15,000 deaths in Europe, but no mention of the strongest regional climate forcing!
This is gross negligence.
On January 1st 2020 new shipping regulation came into effect (
#IMO2020
), decreasing the maximum amount of sulfur in shipping fuels from 3.5% to 0.5%.
From 2020 we see a rapid increase in the amount of solar radiation that's being absorbed by the region highlighted above.
🌊🌡️📈
The North Atlantic Ocean reached 365 days of continuous record high temperatures!
Thank you to the journalists who have accurately reported on this!
E.g:
Scientists warn Earth warming faster than expected — due to reduction in ship pollution
🌎🌊🌡📈
January ends with the highest Global average Sea Surface Temperature in observational history.
Prepare for a lot of crazy weather in the pipeline!
Sulfur emissions cooled our planet by about 0.5°C, on a global average.
It cooled more where most of us live.
3.5 years ago we reduced sulfur emissions over the oceans by about 80%.
Oceans heat up faster.
Prepare for more warming, extreme weather and faster sea level rise.
Mass extinction event! 🪸
"It's looking like the entirety of the Southern Hemisphere is probably going to bleach this year,"
"We are literally sitting on the cusp of the worst bleaching event in the history of the planet,"
Derek Manzello
@CoralReefWatch
WE AIN'T SEEN NOTHING YET!
Global Sea Surface temperatures are about to increase for 4 months, heading for record highs.
This will help to shatter atmospheric temperatures.
The unprecedented atmospheric heat will cause a lot of extreme weather in 2024.
Hold on to your hats.
This has 3.4 million views.
People seem to want to know about, and understand the record Earth's Energy Imbalance.
Why is there so little media coverage on this?
🔥📈BREAKING
@NASA
📈🔥
The Earth Energy Imbalance from NASA satellite data broke through 1.8 W/m² (12-month mean)!
This is faster than I expeced.
More than many experts thought possible.
I called this the most important graph in the world.
A lot more heat is accumulating!
We've spent 5 months above +1.5°C.
Next year we might hit a month of over +2.0°C.
The rate of warming will keep increasing with growing greenhouse gas emissions and decreasing aerosols.
Monthly
@ECMWF
ERA5 Surface Air Temperature Anomalies from 1850-1900 in °C: