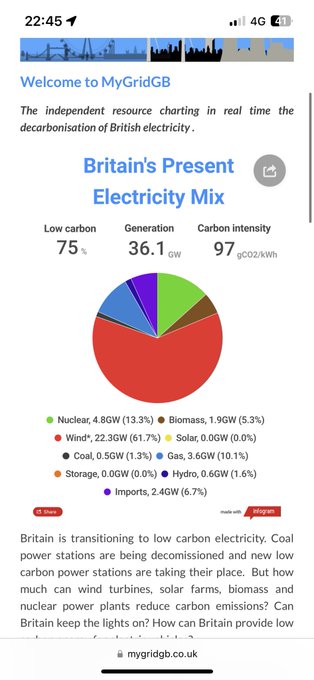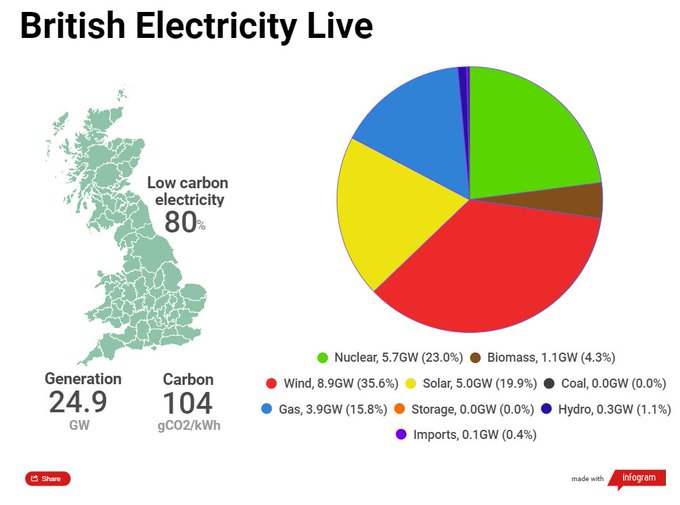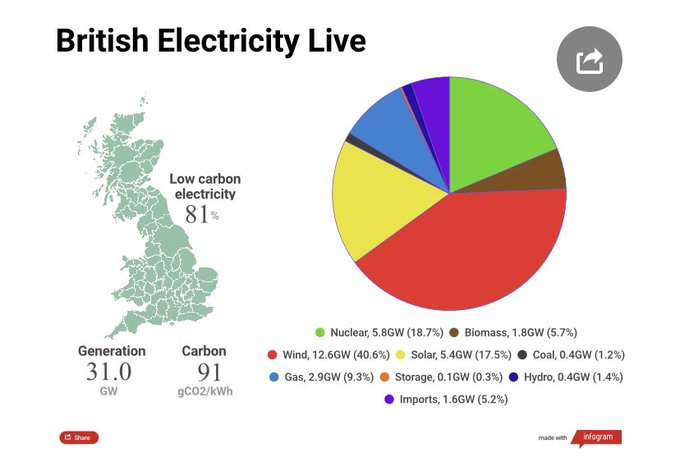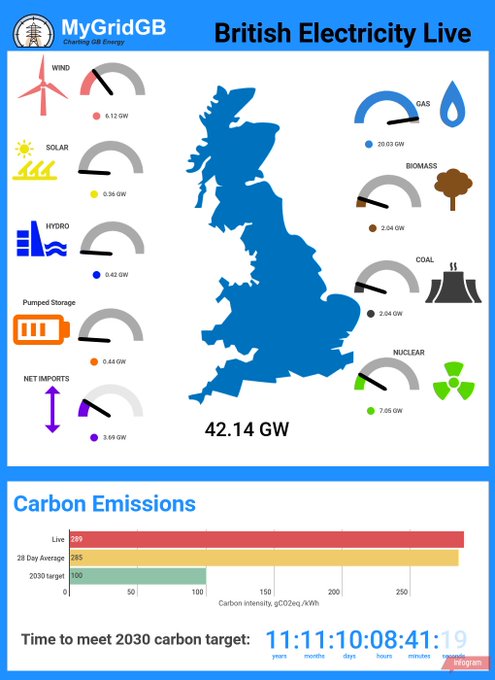
British Electricity Tracker (by Andrew Crossland)
@myGridGB
26,944
Followers
1,003
Following
544
Media
24,202
Statuses
Tweets about the energy transition. Contact and connect at . Support at
Don't wanna be here?
Send us removal request.