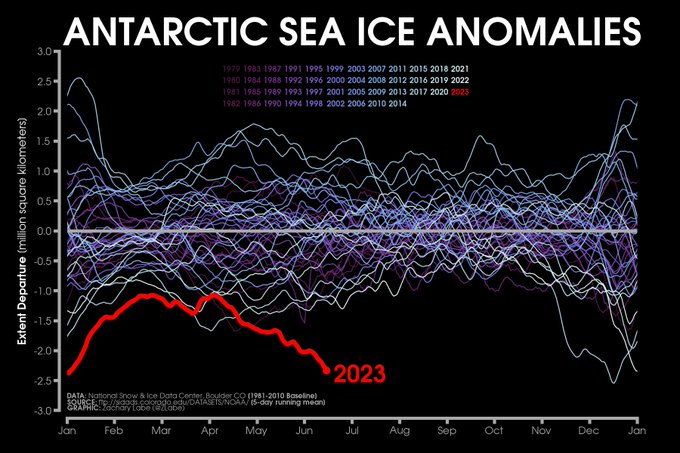
As always, my last tweet of the year - rising carbon dioxide (CO₂)...
There is no deadline. Any reduction in emissions will reduce future climate warming. I am hopeful! Thank you all for following! 🙂
+ Visualization/info by
@gcarbonproject
:
The extreme event continues to unfold in the high
#Arctic
today in response to a surge of moisture and "warmth"
2018 is well exceeding previous years (thin lines) for the month of February. 2018 is the red line. Average temperature is in white ()
I keep thinking we've reached the largest anomaly (in terms of absolute magnitude), but that's not the case yet. The
#Antarctic
departure continues to widen. Apologies if you are tired of seeing me post this same graphic.
Other graphical perspectives at
Wow, January 2020 was the warmest on record and greater than 3°C above the 1981-2010 climate average in Europe. The average global temperature was also the highest on record. 🔥
More info (
@CopernicusECMWF
):
End of 2019 reminder - 5 warmest years on record are in the last 5 years.
Plot shows global climate variability (bumps) and climate change (long-term upward trend). The 12-month running mean is >1.2°C above pre-industrial levels.
[Description of graph: ]
This is Arctic climate change ⬇️
"...the thickest ice—usually more than four years old—had declined by more than 86% since 1985 to make up just 2% of total ice in 2020"
Climatological seasons in 2019... the global temperature is rising 📈🔥
Dec-Feb : 3rd warmest on record
Mar-May : 2nd warmest on record
Jun-Aug : *warmest on record*
Sep-Nov : *warmest on record* (tied)
[Data information: ]
It was an unbelievable year for global climate.
As data is released in the first two weeks of January, you are going to be hearing all about these new climate change records. Apologies for all my graphs in advance!! 😬
Spiral below produced by
@NASAViz
:
A striking visualization of human-caused climate change - watch what happens in the Arctic... 🫠
Temperature anomalies by latitude band (zonal mean) from 1880 to 2022. Visualization produced by
@NASAViz
at . Data from
@NASAGISS
at .
🚨 Carbon dioxide (CO₂) levels set a new *record high* in May 2023 - 424.00 ppm (seasonal max)
"... and represents the fourth-largest annual increases in the peak of the Keeling Curve in NOAA’s record."
+ Press Release: (
@NOAA
):
The negative Antarctic sea ice anomaly has continued to widen for many weeks to the now historic gap.
Ice growth has been much slower than typical, and recall that this February also set the new record low for the seasonal minimum.
Seasonal cycle graphs
Every day I receive messages that the Earth is cooling. It's both amusing and embarrassing. Anyways, here's an animation of what is actually happening to our planet's temperature... 📈🌡️
Created by
@NASAViz
at using
@NASAGISS
GISTEMPv4 data to 2022.
Absolute magnitude of the
#Antarctic
sea ice anomaly is nearly one of the largest on record. It is especially striking for this time of year. While sea ice is growing (austral winter), it's happening much slower than typical.
Find the seasonal cycle here:
Same story continues in the
#Antarctic
over the last few days. Sea ice extent remains more than 2 million square kilometers below average and easily a record low for the date.
More graphs at
#Antarctic
sea ice continues to melt and is quickly approaching the lowest extent on record in the satellite-era.
This previous record was set just last year...
Find more visuals at .
Wow, temperatures exceeded 5°C above average (relative to the 1951-1980 climate baseline) across a massive area of Eurasia last month 🔥
[Data information: ]
Uh, the
#Antarctic
sea ice anomaly continues to grow and is really a pronounced outlier for this time of year in our satellite record... 🥴
+ View other perspectives (including a narrower graph zoom):
Welp, I just had to extend the bottom of this graph... The ice is melting, and the oceans are rising 🌊
Data from GRACE(-FO) satellite observations. Graphic from: . More info on data: .
I've been wanting to get this data visualized on my climate change indicators page, so here it is: - carbon dioxide over nearly the last one million years
Due to anomalously low sea ice conditions at both poles (especially the Antarctic), current global ice extent is the lowest on record for today's date...
+ More graphical perspectives of the satellite-era at:
Levels of
#Antarctic
sea ice continue way below any other year in our satellite record for the date, yikes...
Again, other visualizations available at . Or read more about this ongoing extreme event in and
We are now very close to the all-time record low sea ice extent in the Siberian
#Arctic
(2012).
[Regions include the East Siberian, Laptev, and Kara Seas]
And global sea-ice extent has now set a new *all-time* record low...
➡️ Arctic (2nd lowest on record for date) + Antarctic (lowest on record for date)
[Graphics: . Data from for the satellite-era. I am using a 5-day running mean.]
Well it was another year with the same climate change story. Surprise!
Red shading shows warmer than average temperatures.
Overall, the average global temperature in 2021 was +0.85°C (1.53°F) above the 1951-1980 baseline (or +1.12°C (2.02°F) above 1880-1920).
#Antarctic
sea ice extent has stayed below the previous all-time record low for over two weeks now...! 😵💫
[Preliminary data using the 5-day trailing mean; explore with ]
The most intense surge of moisture/warmth (relative to average) for this event will be pushing over the North Pole tomorrow. Temperatures projected near 0°C. Meanwhile, brutal cold remains over Europe.
Graphics available from
No surprises here - Arctic Ocean warming stripes. The Arctic is warming faster than anywhere else in the world.
#ShowYourStripes
#MetsUnite
Explore your own climate change stripes!
#Antarctic
sea ice continues as the lowest on record for the date (in the satellite-era). The visual here shows how anomalous it actually is for this time of year.
+ More graphs at . Data from
@NSIDC
.
The ongoing loss of multi-year (old) sea ice is one of the most striking visuals of
#Arctic
climate change. Younger sea ice is generally thinner & more vulnerable to melt with numerous impacts to society & the polar ecosystem.
Latest update via
@NSIDC
:
*New Record* -- 2020 averaged the lowest
#Arctic
sea extent in the satellite-era for the month of October.
It was 3,070,000 km² below the 1981-2010 average! Data from
@NSIDC
. The previous October record was 2019...
With ice growth remaining slow, the record
#Antarctic
sea ice anomaly (negative departure from average) continues to somehow get larger in size...
Seasonal cycle graphs at . More info at .
#Arctic
air temperature rank by month over the satellite era - now updated through October 2019...
+ Ranks: 1=warmest (red), 41=coldest (blue)
+ Download visual:
It appears that 2022 has now set a new *all-time* record low sea ice extent in the
#Antarctic
...
[*Note this is preliminary daily data from the
@NSIDC
. There will be small differences between satellite products and temporal averaging methods.]
Temperature anomalies by latitude band for January 2021 - check out the
#Arctic
!
[Plot shows zonal-mean surface air temperature anomalies, where latitude = x-axis (not scaled by distance). Data from
@NASAGISS
(GISTEMPv4)]
Global temperature anomalies by month through May 2023. I find this type of data much more concerning than brief regional extreme graphs.
Note: M = sunspot cycle max, m = sunspot cycle min, V = volcano
[Data from
@NASAGISS
. Graphic was created by ]
This is one of my favorite visuals, especially this time of year (season transitions) - migration patterns of birds varying with air temperature using public science data (
@Team_eBird
/
@CornellBirds
).
[Animation/description by
@NOAA_SOS
at ]
The 12-month running mean global temperature anomaly is statistically tied for the warmest on record (with 2016, in ERA5 data). What a year.
+ More details:
An update through 2022 for this alarming climate change animation...
"The motion has led to this visualization being nicknamed 'the climate jellyfish'" 🪼-
Animation by
@NASAHyperwall
. Data from GISTEMPv4 using a 1951-1980 baseline.
Last month observed temperature anomalies in excess of 5°C in large parts of the Arctic (again)...
Overall, the average March 2022 global air temperature was +1.05°C above the 1951-1980 climate baseline.
The
#Antarctic
sea ice departure has actually grown in the last few days.
Summary of the related atmospheric drivers, like the Amundsen Sea Low, can be found from the
@NSIDC
at . Interannual variability is very large! More graphs: .
*New Record* -- 2020 averaged the lowest
#Arctic
sea extent in the satellite-era for the month of July.
It was 2,190,000 km² below the 1981-2010 average! Data from
@NSIDC
.
I periodically post this visualization reminder as summer approaches in the Northern Hemisphere - think heatwaves 🫠
The changing distribution of land temperature anomalies since 1950...
Animation is by
@NASAViz
using GISTEMPv4 data. More information at .
Total
#Arctic
sea ice extent is currently the 6th lowest on record (JAXA data)
Compared to previous decades:
• about 430,000 km² less the 2000s mean
• about 990,000 km² less the 1990s mean
• about 1,330,000 km² less the 1980s mean
Additional plots:
🚨 Last month was statistically tied for the *warmest* April on record for our planet. Striking 'warmth' across northern Siberia again.
Data from ERA5. Summary at
Yay! It's that time of year again (season transitions) where I share one of my favorite visualizations - migration patterns of birds varying with air temperature using community science data (
@Team_eBird
/
@CornellBirds
). Enjoy! 🙂
Animation created by
Once again, as a result of unusually low sea ice conditions at both poles (especially in the Antarctic), global ice extent is currently the lowest on record for the time of year...
+ More graphical perspectives of the satellite-era at:
An update to the clever visualization for communicating long-term trends versus short-term variability in the global temperature record
#ClimateChange
Available from
@skepticscience
at .
No. Volcanoes are *not* responsible for the current long-term warming of our planet (i.e., climate change).
I used to get a lot of messages about "the sun" (no still) and lately it's now "volcanoes" (🙄).
Figure from
@IPCC_CH
:
I temporarily added another figure of
#Antarctic
sea ice, which will be updated at while the record anomaly continues...
This graph better shows that while sea ice is growing (Austral winter), it's growing much slower than average. The deviation is huge.
The 12-month running-mean global temperature anomaly is more than +1.3°C (relative to 1880-1920)... 📈
Data (GISTEMPv4) updated through September 2020. Graphic/description available at
The extent of global sea ice is now tied for the lowest ever recorded in the satellite-era...
[Graphics: . Note: the poles are affected by very different Earth system processes/seasonality. I am using a 5-day running mean.]
Temperature anomalies greater than 5°C above average were observed across a large portion of the
#Arctic
Circle in February... 🔥
[Data from
@CopernicusECMWF
ERA5 relative to 1981-2010]
The extent of sea ice in the northernmost portions of the
#Arctic
is currently the lowest ever observed...
[Note that the Central Arctic is approximately ≥80°N; see region
#11
at ]
Oh, just posting this for no particular reason 😵💫
Latest monthly updates (
#ClimateChange
):
+ Global temperature: 📈
+ Carbon dioxide (CO₂; new record high): 📈
+ Methane (CH₄): 📈
+ Nitrous oxide (N₂O; new record high) : 📈
Graphic available at