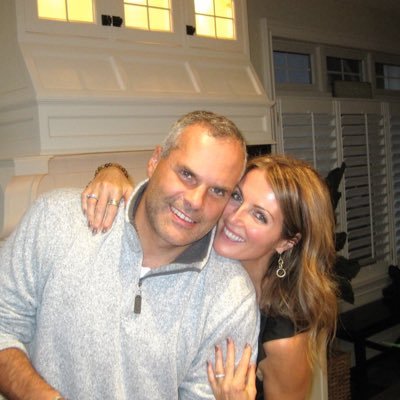
REPEAT AFTER ME: We get rid of outliers when their extremeness indicates they are not part of our population, we do not get rid of them solely because they are extreme.
There once was a model, ANOVA,
who along with their cousin ANCOVA,
made a great big confession:
“We’re the same as regression,
but we’ve established a separate persona.”
⚠️Top 13 worst graph types⚠️:
13. graphs
12. are
11. only
10. as
9. good
8. as
7. their
6. ability
5. to
4. communicate
3. information
2. clearly
1. 3D pie chart
Y’all, my STUDENT made this😂 I’m dying with laughter. I’m sharing it here with their permission.
I really hope my love of stats memes is rubbing off on ALL of them 🤞
Flight attendant: Is there a doctor onboard?
Dad: *nudging me* should've been you
Me: Not now Dad
Dad: Not asking for a statistician to help, are they?
Me: There's a medical emergency happening right now
Dad: Go and see if the bias/variance trade-off is the problem.
I think I have enough followers to be a micro-influencer now (well...at least by academic standards)
Therefore I will now be using the phrase "lots of you have been asking...." to bring up topics that no one asked about, but I want to talk about.
Teaching Neural Nets (very very basic introduction) today
and while I don’t normally like popping peoples bubbles about how *cool* stats is, I think it’s important to demystify things like Neural Nets.
THEY’RE NOT MAGIC😤
OH BOY it’s that time of year again where we take a continuous “measure of performance” (% grade in class), discretize it (A-F), and then have it transformed BACK into a continuous measure (GPA)!!! 🥰 /s
any data scientist born after 1993 can't write excel macros...all they know is tensorflow, send jobs to hpc, stack overflow, be bayesian, hate mysql, & lie
🖼 Remember that one time I randomly tweeted out the idea of a landscape painting with stats/math stuff hidden in it??
🤯 Well...
@skyetetra
MADE IT FOR ME
🪨 My favorite detail: Mandlerock.
🙊 but also...I love all of it.
The “line graph extending beyond the region of the plot” thing seems like a purposeful and perhaps powerful data viz choice.
I tell my students that your aesthetics should emphasize the message of your graph. This choice emphasizes that this isn’t “normal”, it’s quite extreme.
"What do you mean? I definitely think this calls for a hierarchical Bayesian mixed effect logistic regularized machine learning model..." 👼🏼
#statsTikTok
I don't think you understand, when I sign my emails
"Best,
Chelsea"
I am not wishing you well, I am communicating that *I* am in fact, the best Chelsea.
This is not a subtweet of anyone in particular and it's going to annoy some people since I have a lot of Bayesian followers/friends but...one thing I noticed is that once someone uses a strongly informative prior, it becomes 10x harder to convince them they're wrong.