
CryptoCon
@CryptoCon_
97,215
Followers
22
Following
1,456
Media
13,354
Statuses
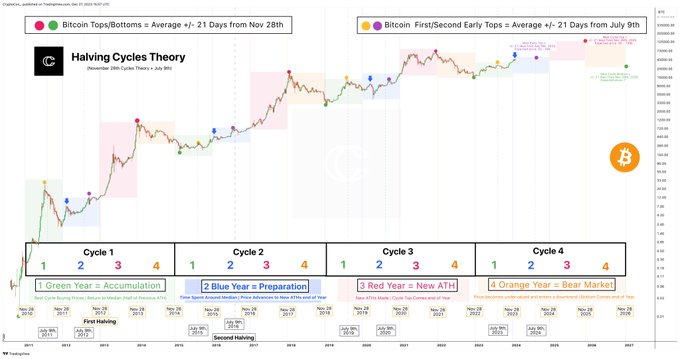
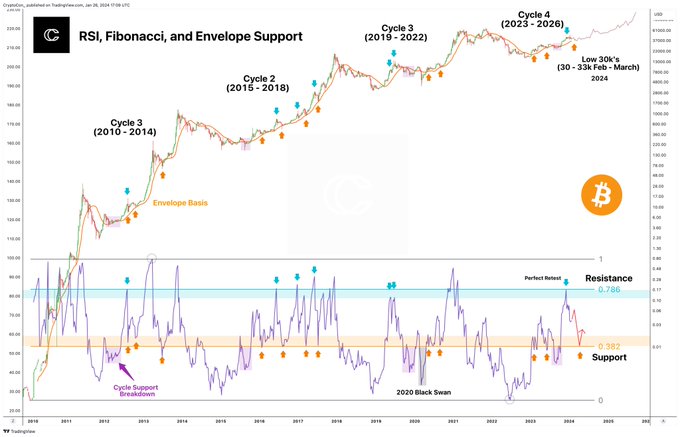
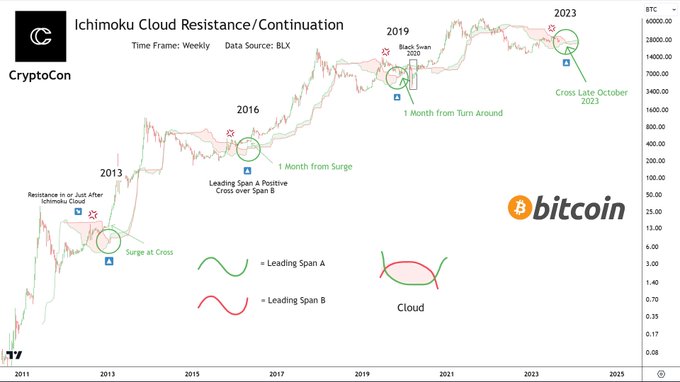
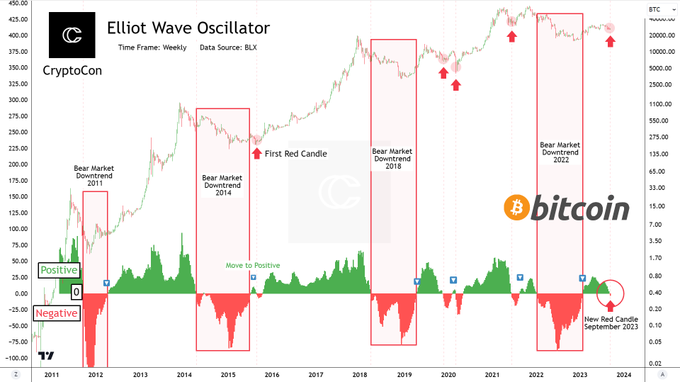
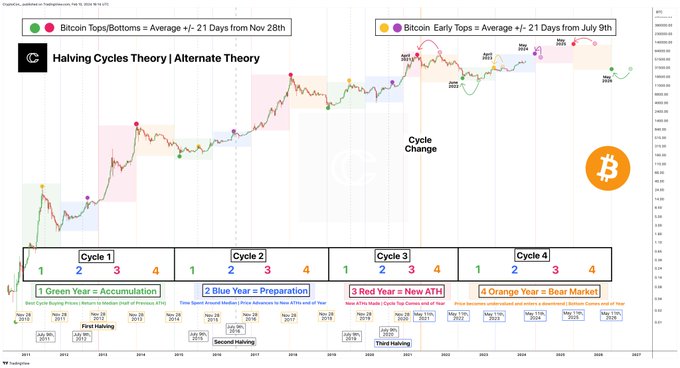
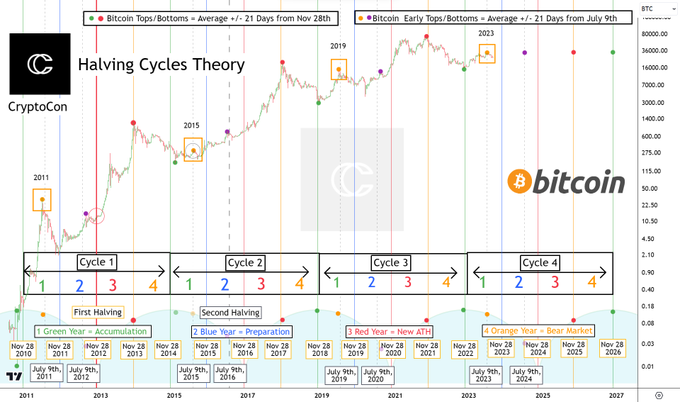
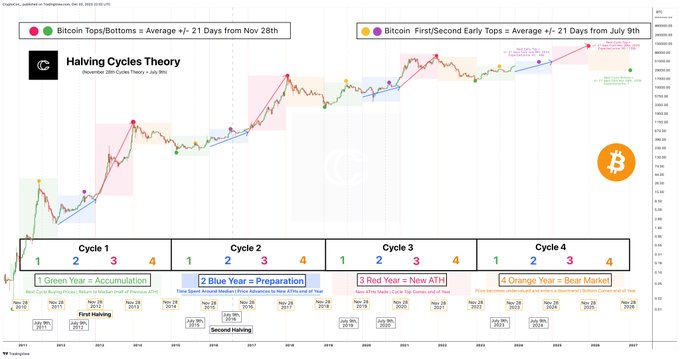
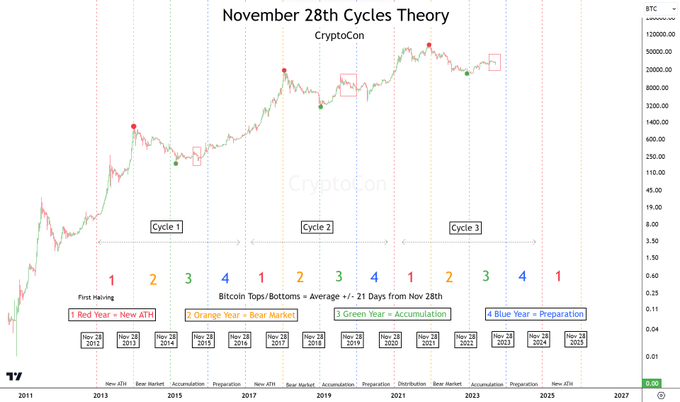
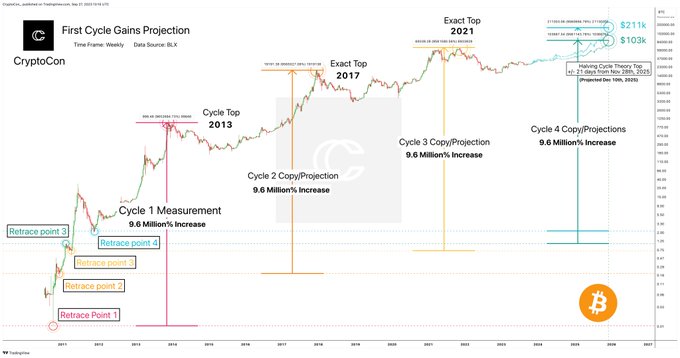
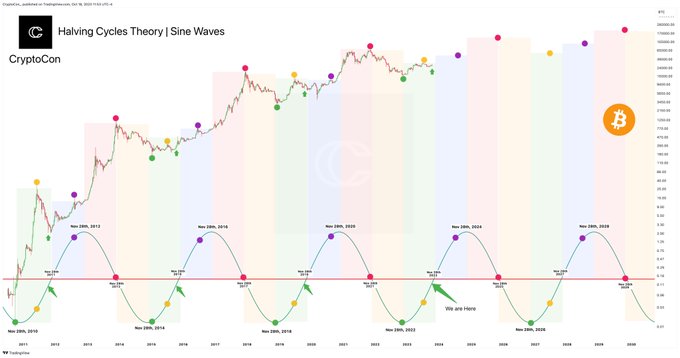
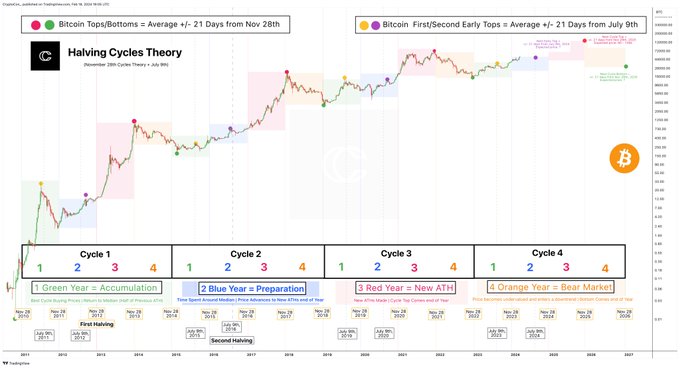
#Bitcoin Technical Analyst || Conservative long-term analysis || Here to help you make money || Creator of the Halving Cycles Theory
Joined September 2018
Don't wanna be here?
Send us removal request.