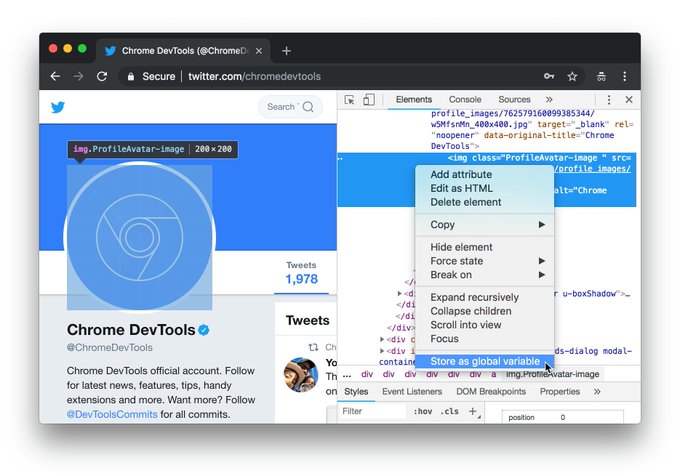
Chrome DevTools Profile
Chrome DevTools

@ChromeDevTools

120,781
Followers
96
Following
648
Media
3,241
Statuses

Official account. Follow for latest news, features, tips and more. Shape the future of DevTools, participate:

Google Chrome
Joined November 2014
Don't wanna be here? Send us removal request.
Pinned Tweet
@ChromeDevTools
Chrome DevTools
24 days
⚡️ What's New in DevTools (Chrome 124) 🧻 New autofill panel 🕞 Throttle WebRTC 🧮 Enhanced scroll-driven animations inspection ... and more! Update your Chrome and give them a try. 👉
Tweet media one
3
8
48
@ChromeDevTools
Chrome DevTools
5 years
Congratulations @FirefoxDevTools . Great feature.
@FirefoxDevTools
Firefox DevTools
5 years
🌅 Now in Beta: Inactive CSS! We show you which CSS properties aren’t affecting the selected element and why. (Has this saved you time already? We love hearing from you and seeing screenshots!) — @violasong
Tweet media one
57
1K
5K
19
527
3K
@ChromeDevTools
Chrome DevTools
5 years
Rerunning code that declare let-variables no longer cause failures in DevTools console. We hope this makes trying out code more convenient!
62
491
2K
@ChromeDevTools
Chrome DevTools
6 years
Tip: Run copy(obj) in the Console to copy an object to your clipboard.
28
975
2K
@ChromeDevTools
Chrome DevTools
7 years
Introducing Puppeteer: A modern Node.js API for headless Chrome. Built with ❤️ by the Chrome team.
Tweet media one
26
1K
2K
@ChromeDevTools
Chrome DevTools
4 years
It's almost here: CSS grid tooling! 🤘 Over the last couple of months, we teamed up with @EdgeDevTools to work on this highly-requested feature. Here is a sneak preview. We have many more ideas on how to make grids easier and more accessible in the future – stay tuned!
27
553
2K
@ChromeDevTools
Chrome DevTools
6 years
Tip: Type $_ in the Console to return the value of the last evaluated expression.
Tweet media one
19
748
2K
@ChromeDevTools
Chrome DevTools
7 years
Now in Canary: Capture screenshots of specific HTML nodes
48
1K
2K
@ChromeDevTools
Chrome DevTools
4 years
Now you can right click on a node in Elements panel and capture the node screenshot! 📸 Like it? Freshly landed on Chrome Canary. Update and give it a try! 🔥
Tweet media one
26
482
2K
@ChromeDevTools
Chrome DevTools
6 years
Tip: Format your console.log statements by prepending your text with "%c" and passing a second argument that contains the CSS styles.
Tweet media one
19
485
2K
@ChromeDevTools
Chrome DevTools
5 years
New feature in Chrome 73: Logpoints. Log messages to the Console without cluttering up your code with console.log() calls.
@NetanelBasal
Netanel Basal
5 years
⭐️ 🚀 @googlechrome 73: Logpoints 🔥🚀👯
8
243
589
11
638
2K
@ChromeDevTools
Chrome DevTools
6 years
Coming 🔜in Chrome 65: Contrast ratio in the Color Picker. That white line divides high contrast versus low contrast.
Tweet media one
15
528
1K
@ChromeDevTools
Chrome DevTools
6 years
Tip: Use the Animation Inspector + Layers panel to visually understand how all those amazing animations you see across the web are created.
4
377
1K
@ChromeDevTools
Chrome DevTools
8 years
CSS @ keyframes now viewable and editable right within Styles. Try it in Canary.
13
801
985
@ChromeDevTools
Chrome DevTools
5 years
Tip: Call console.trace() anywhere in your code to print out a stack trace of the calls leading up to that moment.
Tweet media one
5
252
923
@ChromeDevTools
Chrome DevTools
8 years
Now in Chrome Beta: Visual mobile device art and easy screenshots of the page 📸
8
684
906
@ChromeDevTools
Chrome DevTools
4 years
We realize how cluttered warnings on the console can be. In Chrome 84, we are starting to organize warnings in the new Issues tab, with actionable guidance and links to resources within DevTools. We hope that this helps you find and fix problems.
Tweet media one
Tweet media two
21
235
900
@ChromeDevTools
Chrome DevTools
5 years
Initial DWARF support has landed in Chrome DevTools! It means that you can resolve stack traces, set breakpoints and step-in/-over source code in C/C++/Rust natively, without generating source maps.
Tweet media one
15
292
892
@ChromeDevTools
Chrome DevTools
8 years
Now in Canary: Shadow Editor
19
516
757
@ChromeDevTools
Chrome DevTools
6 years
Now in Canary: Autocomplete in the Console after calling a function. Top window is the old behavior, bottom window is the new.
Tweet media one
14
199
742
@ChromeDevTools
Chrome DevTools
6 years
Tip: Run getEventListeners(element) in the Console to get an array of that element's event listeners. Passing $0 (like in the screenshot) returns the listeners for whatever element you've selected in the DOM Tree of the Elements panel.
Tweet media one
4
280
736
@ChromeDevTools
Chrome DevTools
3 years
🌟 Introducing the new Recorder panel 🌟 You can now record, replay and measure user interactions with @ChromeDevTools . See it in action - ordering coffee. ☕️ Learn more about this preview feature (available in Chrome Canary now):
8
230
701
@ChromeDevTools
Chrome DevTools
6 years
Coming soon in Chrome 65: SEO audits
10
345
686
@ChromeDevTools
Chrome DevTools
4 years
We are planning to add adorners to the DOM tree in the Elements Panel for tooling around CSS grid. We have been wondering for what other features we could use adorners, and created a few mocks. Any opinions or ideas?
Tweet media one
Tweet media two
Tweet media three
59
136
639
@ChromeDevTools
Chrome DevTools
4 years
What's New in DevTools in Chrome 85? ✨ • Style editing for CSS-in-CSS • Lighthouse 6 • Support for new JavaScript features Find out more great new features and fixes here 👉🏼
Tweet media one
26
191
629
@ChromeDevTools
Chrome DevTools
4 years
We added some accessibility information to the element pop-over. Check it out in Chrome DevTools on the Canary channel!
Tweet media one
8
182
637
@ChromeDevTools
Chrome DevTools
3 years
How we migrated @ChromeDevTools (150k lines of code) to TypeScript. @TimvdLippe will describe our 13-month journey moving away from the Closure Compiler type checker. This is the 3rd post in our architecture refresh series! 👉🏼
Tweet media one
6
188
628
@ChromeDevTools
Chrome DevTools
4 years
In collaboration with Mozilla, we’re proud to announce Puppeteer v2.1.0! 🔥 The new version works with Chromium 80 and now supports official Firefox binaries as well.
5
163
618
@ChromeDevTools
Chrome DevTools
2 years
Woo-hoo! 🎊 Official @Cypress_io extension to export user flows as Cypress Tests. Also, Recorder will auto-pick "data-cy" as the default selector (if it's defined) out of the box. Seamless process to create Cypress Tests! 👉🏼 📜
5
134
611
@ChromeDevTools
Chrome DevTools
4 years
Do you have a set of console commands that you repeat often? You don't have to go through console history for that! You can execute snippets in the command menu (Cmd+P or CTRL+P) with ! as prefix.
6
173
590
@ChromeDevTools
Chrome DevTools
5 years
I've been working on DevTools for 3 years and just learned yesterday that this little device orientation model thing is interactive 🤯 --- @kaycebasques
10
141
552
@ChromeDevTools
Chrome DevTools
8 years
Now in Canary: CPU Throttling! A crucial tool for mobile-first development.
6
339
532
@ChromeDevTools
Chrome DevTools
9 years
Protip: Adding [contenteditable] to the <body> allows for some speedy text changes.
10
423
526
@ChromeDevTools
Chrome DevTools
6 years
New tutorial: Optimize Website Speed. A hands-on tutorial for learning how to use DevTools to find ways to make your sites faster. Special guest appearance by Tony the cat.
Tweet media one
Tweet media two
7
190
518
@ChromeDevTools
Chrome DevTools
6 years
New Feature in Chrome 70: Live Expressions. Pin a JavaScript expression to your Console to keep track of its value in real-time.
5
207
513
@ChromeDevTools
Chrome DevTools
1 year
Ouch, bitten by CORS errors. With the new prototype, you can override the "Access-Control-Allow-Origin header" locally to see if the proposed solution (in console) works! Share your thoughts in our RFC - we want your feedback! 👉🏼 #ChromeDevTools #RFC
Tweet media one
5
78
494
@ChromeDevTools
Chrome DevTools
4 years
Did you notice that we redesign the breakpoint and logpoint in Chrome Canary? 👀 It's much easier to differentiate them now. Comment and let us know if you like it! 😃 Don't you think these colors look good in both light and dark theme? 😉
Tweet media one
20
81
477
@ChromeDevTools
Chrome DevTools
6 years
Tip: use console.count(label) to count how many times that line executes.
6
176
472
@ChromeDevTools
Chrome DevTools
6 years
Now in Canary: Function argument hints in the Console. As you type out a function, the Console shows you the expected arguments for that function.
Tweet media one
8
121
465
@ChromeDevTools
Chrome DevTools
6 years
Coming soon in Chrome 65: Multiple recordings in the Performance panel
Tweet media one
12
159
449
@ChromeDevTools
Chrome DevTools
2 years
✨ Woo-hoo! You can now export, convert and replay user flows with Cypress! 📹 Try out the new @Cypress_io Chrome Recorder library 👉🏼
7
135
454
@ChromeDevTools
Chrome DevTools
7 years
Check out our new tutorial on analyzing runtime performance
Tweet media one
1
211
453
@ChromeDevTools
Chrome DevTools
7 years
Did you wake up on a mission to learn every perf feature in DevTools? Well friend, we've got a new doc just for you
3
225
452
@ChromeDevTools
Chrome DevTools
6 years
Now in Canary: "Copy as Fetch" (GIF by @umaar )
6
180
437
@ChromeDevTools
Chrome DevTools
4 years
The DevTools colorpicker now produces modern CSS color syntax, as opposed to the legacy comma-based syntax.
@mathias
Mathias Bynens
4 years
💡 In source code, stop using the old rgb()/hsl() CSS color syntax with commas. Get used to the modern comma-free CSS color syntax, supported in all modern browsers. Why? Upcoming new features such as lab(), lch(), and color() use the same syntax (and don’t work with commas).
Tweet media one
90
1K
4K
7
111
406
@ChromeDevTools
Chrome DevTools
5 years
New in Chrome 74: Capture area screenshots from the Command Menu.
9
132
384
@ChromeDevTools
Chrome DevTools
1 year
New RFC ✨ - Override HTTP response headers Override, reload the page and viola! Experiment response header values locally without changing server config. Useful to test CORS, Permissions-Policy & more. Try out the prototype and send us your feedback 👉
Tweet media one
6
79
373
@ChromeDevTools
Chrome DevTools
6 years
New feature in Chrome 70: Type an expression that evaluates to a node and Eager Evaluation highlights that node in the viewport.
Tweet media one
4
94
355
@ChromeDevTools
Chrome DevTools
6 years
Now in Canary: Search for text across all network headers.
Tweet media one
3
93
352
@ChromeDevTools
Chrome DevTools
8 years
Ever tried to paste JSON into the Console and saw it fail? We've finally fixed it (in )
Tweet media one
14
305
342
@ChromeDevTools
Chrome DevTools
6 years
On Friday we released a video version of our "Optimize Site Speed" tutorial. Covers the Audits panel, the Coverage tab, request blocking, and the Performance panel. Vid: Doc:
Tweet media one
1
120
336
@ChromeDevTools
Chrome DevTools
1 year
🚀 Discover how leading frameworks & build tools like @nuxt_js , @angular , @vite_js , and @RollupJS supercharge your debugging experience with the "x_google_ignoreList" source maps extension. Dive into our article:
Tweet media one
6
48
339
@ChromeDevTools
Chrome DevTools
6 years
Now in Canary: ES8 keywords (like await) in the Console's autocomplete UI
Tweet media one
1
87
319
@ChromeDevTools
Chrome DevTools
3 years
What's new in DevTools in Chrome 88? ✨ 🕔 New CSS angle swatch 🖼 Emulate AVIF and WebP images 🗄 Simulate storage quota size Try in Chrome Canary today! Full list of goodies 👉🏼
Tweet media one
7
73
311
@ChromeDevTools
Chrome DevTools
2 years
⚠️ Spoiler alert! A new Performance Insights panel is coming in Chrome Canary. 👀 It's experimental, so... give it a try and share with us your thoughts!
7
90
307
@ChromeDevTools
Chrome DevTools
6 years
StyleURL: A Chrome Extension for exporting CSS changes from DevTools to a GitHub Gist.
Tweet media one
2
105
309
@ChromeDevTools
Chrome DevTools
9 years
New in DevTools: ⚡Aggregated timeline details, 🎨color palettes, 📰new main menu and much more. http://t.co/PUGfTFlSBP
6
378
307
@ChromeDevTools
Chrome DevTools
3 months
[1/2] Yes, we hear you, we are working on restoring the old filter bar in Network panel to Chrome 121 (stable). Track the progress here: In the meantime...
Tweet media one
18
20
306
@ChromeDevTools
Chrome DevTools
5 years
V nice new Flexbox feature from the good people at @FirefoxDevTools
@FirefoxDevTools
Firefox DevTools
5 years
Now in Firefox Dev Edition: When inspecting a Flexbox item, the sidebar shows a diagram illustrating basis, shrink/grow, and min/max. Below is a step-by-step description of how the item got its size. We'd love your feedback on this feature! — @violasong
Tweet media one
41
627
2K
5
46
297
@ChromeDevTools
Chrome DevTools
8 years
console.table(obj, [propName1, propName2]) makes for easy browsing of objects.
Tweet media one
6
149
298
@ChromeDevTools
Chrome DevTools
9 years
We've moved! Visit the new DevTools homepage for action-oriented tutorials, tips, and news. http://t.co/vI3ArxjvBw
Tweet media one
4
248
298
@ChromeDevTools
Chrome DevTools
5 years
New in Chrome 77: Lighthouse 5.1 in the Audits panel. Includes a new audit for checking that a PWA can be added to iOS homescreen, a diagnostic audit that reports request counts and file sizes broken down by categories like scripts, and a new speed metric.
Tweet media one
1
91
293
@ChromeDevTools
Chrome DevTools
6 years
I spy with my little eye a fancy new Audits UI
Tweet media one
5
62
294
@ChromeDevTools
Chrome DevTools
3 years
Wow, we reached 10,000 commits! 🎉
Tweet media one
2
14
290
@ChromeDevTools
Chrome DevTools
4 years
What's new in DevTools in Chrome 87? ✨ 🤩 New CSS Grid debugging tools!!! 🔐 New WebAuthn tab ⚒ Move tools up and down 📟 New Computed sidebar pane Try in Chrome Canary today! Full list of goodies 👉🏼
Tweet media one
6
92
290
@ChromeDevTools
Chrome DevTools
4 years
🥁 *drumroll* Introducing the new #ChromeDevTools engineering blog! The first post by @TimvdLippe will take you through our journey of migrating DevTools from legacy custom module format to JavaScript modules. Stay tuned for more engineering content! 🤩
Tweet media one
2
98
287
@ChromeDevTools
Chrome DevTools
6 years
Now in Chrome 64: Select an element in the DOM Tree, and the new #Accessibility pane shows you that element's position in the accessibility tree, as well as its ARIA attributes and computed properties.
Tweet media one
5
147
274
@ChromeDevTools
Chrome DevTools
3 years
Chrome 87 is here! 🎉 Try inspect CSS Grid with our new debugging tools! 📐 On top of that, with just 1 click, DevTools now detect all color contrast issues of your page (experimental). Excited? Update your Chrome today! Full list of what's new 👉🏼
Tweet media one
3
69
276
@ChromeDevTools
Chrome DevTools
6 years
New in Chrome 71: Store DOM nodes as global variables. Also available from the Console when you right-click an expression result that evaluated to a node.
Tweet media one
2
106
269
@ChromeDevTools
Chrome DevTools
6 years
Coming soon in Chrome 66: The Preview tab pretty-prints minified resources by default. You can still inspect the original, minified code via the Response tab.
Tweet media one
7
102
277
@ChromeDevTools
Chrome DevTools
6 years
Tip: Run monitorEvents(nodeReference, eventName) in the Console to log a message whenever that listener fires.
0
95
266
@ChromeDevTools
Chrome DevTools
6 years
Coming soon in Chrome 65: The Changes tab. View all changes you've made in DevTools on a file-by-file basis.
Tweet media one
7
87
267
@ChromeDevTools
Chrome DevTools
6 years
Coming to Chrome 65: Local Overrides. Make a tweak and DevTools saves the changed file to a location of your choosing. On next load, DevTools loads the local file rather than going to the network.
9
123
267
@ChromeDevTools
Chrome DevTools
4 years
Chrome 85 is here! 🎉 Be sure to update your Chrome and audit your page with the latest Lighthouse (with Core Web Vitals, ) in DevTools and more! Full list of What's new in DevTools 👉🏼
Tweet media one
5
83
263
@ChromeDevTools
Chrome DevTools
3 years
📣 New blog post! @bmeurer explains how we sped up Chrome DevTools stack traces by 10x.⚡️ Read 👉🏼
4
54
260
@ChromeDevTools
Chrome DevTools
7 years
Also in Canary: Section Screenshots. Enable Inspect Mode -> Hold Cmd (Mac) or Ctrl (Win, Linux) -> Click & Drag & Release -> 📸 -> 🌟✨
3
132
256
@ChromeDevTools
Chrome DevTools
3 years
✨ Qué hay de nuevo en DevTools (Chrome 92) ✨ Editor de CSS Grid, soporte para la redeclaración de 'const' en la consola, visor de orden de los elementos y más! ¡Gracias @midudev por la traducción al español! 👉🏼
Tweet media one
1
63
252
@ChromeDevTools
Chrome DevTools
3 years
✨ What's New in DevTools in Chrome 90? 📐CSS flexbox debugging tools (woohoo!) ⚡️ Core Web Vital overlay (View performance metrics on screen real-time) 🔑 New Trust Tokens pane 💽 Improved PWA tooling ... and more. Try in Chrome Canary today! 👉🏼
Tweet media one
13
90
250
@ChromeDevTools
Chrome DevTools
4 years
Ever wanted to capture a snapshot of just a part of a web page? Thanks to @JecelynYeen we now have a context menu item in the Elements panel to do exactly that!
5
67
249
@ChromeDevTools
Chrome DevTools
2 years
Chrome 96 is rolling out now! Try out these new features in DevTools: 🌈 The long-awaited CSS Overview panel is now available for preview! 🐞 Restored and improved CSS length edit and copy experience Read more 👉🏼
Tweet media one
4
57
242
@ChromeDevTools
Chrome DevTools
6 years
New doc: #Accessibility Reference (A comprehensive reference of #a11y features in DevTools) Feedback welcome
Tweet media one
3
107
235
@ChromeDevTools
Chrome DevTools
6 years
Tip: Select a node and press H to hide it, or press Delete to remove it. (Also, press Command+Z / Control+Z to undo your changes)
1
76
237
@ChromeDevTools
Chrome DevTools
4 years
Chrome DevTools helps you debug SameSite cookie issues. In Chrome 80, the Network Panel offers a filter for requests that were blocked from setting cookies. Reload the page while DevTools is open to see which cookies were blocked, and why.
Tweet media one
2
97
237
@ChromeDevTools
Chrome DevTools
6 years
Tip: Use XHR/Fetch breakpoints to pause when a network request (initiated by your JS) matches a particular pattern.
0
96
232
@ChromeDevTools
Chrome DevTools
6 years
Web guru @addyosmani recently put out an awesome article on JS startup optimization that you should totally check out. Or not. I'm a dev tool. Not a cop.
Tweet media one
2
65
228
@ChromeDevTools
Chrome DevTools
9 years
When debugging JS, DevTools now highlights the exact column as opposed to the entire line. Useful with minified code! http://t.co/qumhwTTXYf
Tweet media one
7
247
223
@ChromeDevTools
Chrome DevTools
9 years
Checkout ScratchJS, a DevTools extension that allows you to execute ES6/ESNext/ES2015 code. http://t.co/uayUP9zoBN
Tweet media one
2
180
228
@ChromeDevTools
Chrome DevTools
9 years
New in DevTools: Film strip on Timeline and Network plus a new home for network throttling. http://t.co/DEnxb6zwq4
Tweet media one
3
241
224
@ChromeDevTools
Chrome DevTools
2 years
🔥 Chrome 98 is here! Update now to use these new DevTools features: 🌴 Toggle to view full-page accessibility tree 🕣 Set timeout to wait for record / replay user flow 📦 New bfcache tab 📺 👉🏼
Tweet media one
4
58
211
@ChromeDevTools
Chrome DevTools
5 years
New in Chrome 73: Export code coverage data.
Tweet media one
8
82
210
@ChromeDevTools
Chrome DevTools
3 years
✨ TGIF! New #engineering blog post. 😃 CSS-in-JS is different from regular CSS, and you can use DevTools to edit both! In this post, @orkon will explain: ▶️ What is CSS-in-JS ▶️ How we implement CSS-in-JS authoring in DevTools 👉🏼
Tweet media one
2
67
211
@ChromeDevTools
Chrome DevTools
6 years
Tip: Find what code caused a network request with the Initiator column.
Tweet media one
1
69
208
@ChromeDevTools
Chrome DevTools
4 years
What's new in DevTools in Chrome 86? ✨ 📹 New Media panel 👋🏽 Goodbye Issues warning bar 🤖 3 new emulations 📸 Capture node screenshot Try in Chrome Canary today! Full list of goodies 👉🏼
Tweet media one
7
63
201
@ChromeDevTools
Chrome DevTools
6 years
Tip: Run keys(object) and values(object) in the Console to see an object's keys and values.
Tweet media one
3
45
205
@ChromeDevTools
Chrome DevTools
5 years
New in Chrome 77: Copy a DOM node's styles. After iterating on styles, right-click the node in the DOM Tree > Copy > Copy styles to copy your changes to your clipboard. Thanks @argyleink and VisBug for the inspiration.
Tweet media one
1
79
200
@ChromeDevTools
Chrome DevTools
4 years
Ever wondered how to break on Array.prototype.sort, but only if every element in the array is a hiragana character?
Tweet media one
10
38
204
@ChromeDevTools
Chrome DevTools
8 years
Canary: Due to popular demand, we brought back the dimensions that appear on page resize (when not in Device Mode).
Tweet media one
16
73
204
@ChromeDevTools
Chrome DevTools
6 years
Using the React DevTools Profiler to Diagnose React App Performance Issues by @Netlify
Tweet media one
0
58
199
@ChromeDevTools
Chrome DevTools
3 years
Chrome DevTools team is hiring! Please reach out to @hashseed if you are interested.
4
90
201
@ChromeDevTools
Chrome DevTools
9 years
Any JavaScript edits made in DevTools will now be proactively compiled by V8 to detect errors early. (Canary) http://t.co/V5GzuChPj4
8
250
198
@ChromeDevTools
Chrome DevTools
1 year
New RFC ✨ - We are redesigning the Breakpoints pane to allow quicker access to common actions. Try out the prototype and send us your feedback 👉
Tweet media one
5
26
201