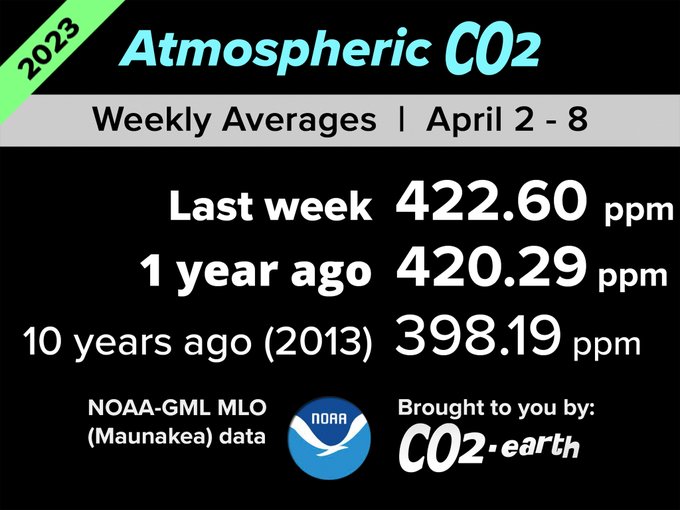
CO2_Earth Profile Banner
CO2_Earth Profile
CO2_Earth

@CO2_earth

33,681
Followers
12,182
Following
3,281
Media
6,925
Statuses

Real-time, global signal for living well on Earth #CO2 #energy #green #solutions #sustainability Posts by the creator of , Michael McGee b. 318 ppm

The Atmosphere @ 3400 Metres
Joined June 2009
Don't wanna be here? Send us removal request.
@CO2_earth
CO2_Earth
4 years
🏆📈🏆  415.79 ppm #CO2 in Earth’s atmosphere on January 21, 2020 🏆 HIGHEST EVER daily average at Mauna Loa Observatory 🏆 Up from 413.21 ppm a year ago (Jan 20/19) 🏆 #NOAA data & graphic: 🏆 Daily records:
Tweet media one
88
767
1K
@CO2_earth
CO2_Earth
3 years
🏆📈🏆  419.45 ppm #CO2 in Earth’s atmosphere on February 5, 2021 🏆 HIGHEST EVER daily average at the Mauna Loa Observatory 🏆 Up from 413.85 ppm a year ago 🏆 #NOAA source: 🏆 records:
Tweet media one
94
515
1K
@CO2_earth
CO2_Earth
1 year
🌍 🏆📈 Atmospheric CO2 just hit the HIGHEST EVER level IN HUMAN HISTORY at Mauna Loa 🏆😰 423.01 ppm on Apr 6 2023 😰🏆 Up 3.84 ppm from 419.17 one year ago 😰 @NOAA live data: 🌍 Track records @ 🌍
Tweet media one
175
870
1K
@CO2_earth
CO2_Earth
4 years
🏆📈🏆  416.08 ppm #CO2 in Earth’s atmosphere on February 10, 2020 🏆 HIGHEST EVER daily average at the Mauna Loa Observatory 🏆 Up from 411.97 ppm a year ago 🏆 #NOAA source: 🏆 records:  🏆📈🏆
Tweet media one
98
1K
1K
@CO2_earth
CO2_Earth
4 years
🏆📈🏆  418.03 ppm #CO2 in atmosphere May 1 2020 🏆 HIGHEST EVER daily avg in HUMAN HISTORY @ Mauna Loa Observatory 🏆 Was 414.88 ppm 1 year ago 🏆 #DATA : 🏆 RECORDS:  🏆 Emissions R too high despite #COVID19 emissions reductions 😷
Tweet media one
72
798
1K
@CO2_earth
CO2_Earth
4 years
📈 413.99 parts per million (ppm) #CO2 in the atmosphere January 5, 2020 📈 Up from 409.05 ppm 1 year ago 📈 Mauna Loa Observatory @NOAA data & graphic: 📈 tracking:  🙏 View & share often 🙏
Tweet media one
53
532
1K
@CO2_earth
CO2_Earth
3 years
🏆📈🏆  421.21 ppm #CO2 in Earth’s atmosphere on April 3, 2021 🏆 HIGHEST EVER daily average at the Mauna Loa Observatory & 1st time > 420 ppm 🏆 Up from 415.60 ppm a year ago 🏆 #NOAA source: 🏆 records:
Tweet media one
55
786
1K
@CO2_earth
CO2_Earth
1 year
🏆🌍🏆 New DAILY #CO2 RECORD HIGH for Humankind 🏆🌍🏆 425.01 ppm @ Mauna Loa Apr 28 2023 😰 Up 5.85 from 419.16 ppm one year ago 😰 First > 425 😰 @NOAA data via 'MKO' & 🌍 records 🌍
Tweet media one
164
499
990
@CO2_earth
CO2_Earth
3 years
🏆📈🏆  421.36 ppm #CO2 in Earth’s atmosphere on April 8, 2021 🏆 HIGHEST EVER daily average at the Mauna Loa Observatory 🏆 Up from 416.96 ppm a year ago 🏆 #NOAA source: 🏆 records:  🌍😰 #EarthSaysOuch 😰🌍
Tweet media one
35
443
923
@CO2_earth
CO2_Earth
4 years
🏵️📈🏵️ ATMOSPHERIC #CO2 SMASHES PAST 417 PPM FOR 1st TIME IN HUMAN HISTORY TO SET NEW RECORD HIGH AT MAUNA LOA 🏵️📈🏵️ 417.91 ppm #CO2 on April 8, 2020 #Scripps - ) 📈 Daily records 🙏 Good Friday Blessings 🙏
Tweet media one
@Keeling_curve
Keeling_Curve
4 years
417.91 parts per million (ppm) CO2 in air 08-Apr-2020
5
99
114
44
569
889
@CO2_earth
CO2_Earth
5 years
🏆📈🏆 Humanity's FIRST DAY EVER with #CO2 in air > 415 ppm at Mauna Loa 🏆 415.09 ppm CO2 on May 3, 2019 🏆 @keeling_curve source: 🏆 Records tracked at 🙏 #MayThe4thBeWithYou 🙏
Tweet media one
59
1K
898
@CO2_earth
CO2_Earth
4 years
418.32 ppm #CO2 in Earth’s atmosphere on June 1 2020 🏆📈🏆 HIGHEST-EVER DAILY AVERAGE CO2 LEVEL AT MAUNA LOA--IN MILLIONS OF YEARS 🏆📈🏆 Up from 414.14 ppm 1 year ago  | Track records at: | #NOAA data:
Tweet media one
18
493
888
@CO2_earth
CO2_Earth
1 year
🌍 🏆📈 Atmospheric CO2 just hit another RECORD HIGH at Mauna Loa 🏆😰 423.23 ppm on Apr 12 2023 😰🏆 😰 Third new RECORD this week! 😰 Up 4.24 ppm from 418.99 one year ago 😰 Daily data live from @NOAA 🌍 🙏 Track records 🙏 🌍
Tweet media one
81
458
912
@CO2_earth
CO2_Earth
2 years
🏵️🏵️  HIGHEST-EVER WEEKLY #CO2 LEVEL WITH HUMANS ON EARTH  🏵️🏵️ 📈 421.13 ppm #CO2 in the atmosphere in the 19th week of 2022 📈 Up from 418.34 a year ago 📈 @NOAA Mauna Loa data: 🌍 Track records: 🌍
Tweet media one
40
671
898
@CO2_earth
CO2_Earth
4 years
🏆📈🏆  416.96 ppm #CO2 in Earth’s atmosphere on April 8, 2020 🏆 HIGHEST EVER daily average at the Mauna Loa Observatory 🏆 Up from 412.31 ppm a year ago 🏆 #NOAA source: 🏆 records:
Tweet media one
58
495
805
@CO2_earth
CO2_Earth
5 years
OK, @GretaThunberg . No more mamsy pamsy "climate change" talk. 🏁We just passed 415 ppm #CO2 . 🏁 It's time for change. 📢 So, hello #ClimateBreakdown . 📢 Hello #EcologicalBreakdown . 📢 Hello #ClimateDisruption ! Status quo words support status quo inaction. 🐢
@GretaThunberg
Greta Thunberg
5 years
It’s 2019. Can we all now please stop saying “climate change” and instead call it what it is: climate breakdown, climate crisis, climate emergency, ecological breakdown, ecological crisis and ecological emergency? #ClimateBreakdown #EcologicalBreakdown
2K
20K
60K
14
276
818
@CO2_earth
CO2_Earth
3 years
📈 420.65 ppm #CO2 in the atmosphere May 28, 2021 📈 Up from 417.33 ppm a year ago 📈 Mauna Loa Observatory @NOAA data & graphic: 📈 tracking:  🙏 View & share often 🙏
Tweet media one
27
415
788
@CO2_earth
CO2_Earth
2 years
🏆📈🏆 422.06 ppm #CO2 in Earth’s atmosphere on April 26, 2022 🏆 HIGHEST EVER daily average at Mauna Loa 🏆 Up from 420.01 ppm a year ago 🏆 @NOAA data: 🌍 tracking: 🌍 Apologies for the trophies 😰
Tweet media one
39
460
688
@CO2_earth
CO2_Earth
1 month
🏆📈🏆  Earth’s atmosphere just hit 427.93 ppm #CO2 on March 15, 2024 🏆 HIGHEST EVER daily average at MLO 🏆 Up a whopping 7.69 from 420.24 a year ago 🏆 @NOAA : 🌍 : 🌍😰 Keep the 350 ppm overshoot brief!!
Tweet media one
95
471
702
@CO2_earth
CO2_Earth
2 years
🏆📈🏆 Bigger than any #olympics record! 🏆🌍 Earth's daily #CO2 levels just hit 421.59 ppm on Feb 14, 2022 🌍🏆 HIGHEST EVER at Mauna Loa 🏆 Up 5.37 ppm from 416.22 a year ago 🏆 @NOAA data: 🌍 tracking:  🌍
Tweet media one
50
419
687
@CO2_earth
CO2_Earth
1 year
🏆🏆 NEW daily #CO2 RECORD HIGH for Humankind 🏆🏆 424.83 ppm at Mauna Loa Apr 17 2023 😰 Humanity's 6th daily record at Mauna Loa in 12 days! 😰 Up 3.96 from 420.87 a year ago 😰 @NOAA data: 🌍 records: 🌍
Tweet media one
260
394
599
@CO2_earth
CO2_Earth
3 years
📈 419.90 ppm #CO2 in the atmosphere April 11, 2021 📈 Up from 416.33 ppm a year ago 📈 Mauna Loa Observatory @NOAA data & graphic: 📈 tracking:  🙏 View & share often 🙏
Tweet media one
16
182
478
@CO2_earth
CO2_Earth
5 years
📈 414.10 parts per million (ppm) #CO2 in the atmosphere on April 13, 2019 🔗 #NOAA Mauna Loa data & graphic: 👥 Also view daily CO2 updates at
Tweet media one
18
254
363
@CO2_earth
CO2_Earth
5 years
Highest 1-day #CO2 average at Mauna Loa for 2019 was probably 415.70 ppm on May 15, 2019, as reported by @Keeling_curve #Scripps #UCSD [See ] If a higher reading comes in by 2020, will mark the new record at .
@NumberLens
NumberLens
5 years
Have we just seen the peak daily CO2 concentration for 2019? Hopefully yes, but it’s still possible we’ll see even higher values. 2002 peaked on May 27, 2006 May 24 and 2013 May 26. Data: . Daily updates at
Tweet media one
2
27
36
7
169
328
@CO2_earth
CO2_Earth
4 years
🏆📈🏆 NEW ALL-TIME RECORD HIGHS for #CO2 in HUMAN ERA atmosphere @ Mauna Loa Observatory 🏆 #NOAA daily = 418.12 ppm on May 3 2020: 🏆 #Scripps monthly = 416.18 ppm in April 2020: 🏆 CO2 Earth records: 🏆
Tweet media one
24
293
337
@CO2_earth
CO2_Earth
5 years
📈 414.44 parts per million (ppm) #CO2 in the atmosphere on April 28, 2019 🔗 #Scripps #UCSD Mauna Loa data & graphic: 👥 Also view daily CO2 updates at
Tweet media one
17
247
310
@CO2_earth
CO2_Earth
5 years
📈  415.39 parts per million (ppm) #CO2 in the atmosphere on May 16, 2019 📈 #Scripps #UCSD @Keeling_curve data & graphic for Mauna Loa: 📈 Also view daily updates at
Tweet media one
11
166
296
@CO2_earth
CO2_Earth
5 years
🥉📈🥉 414.62 ppm #CO2 in Earth’s atmosphere April 29, 2019🥉 3rd HIGHEST EVER daily average at Mauna Loa 🥉 🔗 @keeling_curve source: 🏆 See records at 👥👥 Cap the warming at 1.5ºC by cutting global emissions 45% by 2030 🙏
Tweet media one
15
219
288
@CO2_earth
CO2_Earth
2 years
📈 417.43 ppm #CO2 in the atmosphere for the 1st week of 2022 📈 Up from 415.44 ppm a year ago 📈 @NOAA Mauna Loa data: 📈 See updates at & this print-ready graphic at 📈
Tweet media one
7
162
280
@CO2_earth
CO2_Earth
1 year
🌎📈 424.60 ppm #CO2 in the atmosphere on Apr. 27 2023 📈 Up a whopping 5.04 ppm from 419.56 a year ago 📈🌎 @NOAA Mauna Loa data via "MKO": 🌎 Daily: 🌎🙏 Pls. help make this sustainability # visible 🙏
Tweet media one
82
179
270
@CO2_earth
CO2_Earth
5 years
📈 414.50 parts per million (ppm) #CO2 in the atmosphere on May 8, 2019 🔗 #NOAA Mauna Loa data & graphic: 👥 Also view daily CO2 updates at
Tweet media one
8
151
247
@CO2_earth
CO2_Earth
3 months
🏆📈🏆  426.50 ppm #CO2 in Earth’s atmosphere February 3, 2024  🏆  HIGHEST daily average recorded at Mauna Loa in human history  🏆 #Scripps @Keeling_curve data & graphic: 🏆 Daily records:
Tweet media one
@Keeling_curve
Keeling_Curve
3 months
426.50 parts per million (ppm) CO2 in air 03-Feb-2024
11
51
70
16
218
263
@CO2_earth
CO2_Earth
1 year
🏆🏆 NEW daily #CO2 RECORD HIGH for Humankind 🏆🏆 424.30 ppm at Mauna Loa Apr 15 2023 😰 Humanity's 5th daily record at Mauna Loa in 10 days! 😰 Up 3.73 from 420.47 a year ago 😰 @NOAA data: 🌍 records: 🌍
Tweet media one
181
192
255
@CO2_earth
CO2_Earth
1 year
🌎📈 424.48 ppm #CO2 in the atmosphere on May 13 2023 📈 Up 2.53 from 421.95 ppm one year ago 📈🌎 @NOAA Mauna Loa data via "MKO": 🌎 Daily: 🌎🙏 Pls. help make this global sustainability # visible 🙏
Tweet media one
59
138
252
@CO2_earth
CO2_Earth
4 years
📈 411.02 parts per million (ppm) #CO2 in the atmosphere November 1, 2019 📈 Up from 406.59 ppm 1 year ago 📈 Mauna Loa Observatory @NOAA data & graphic: 📈 tracking:  🙏 View & share often 🙏
Tweet media one
11
308
231
@CO2_earth
CO2_Earth
4 months
🌎📈 423.21 ppm #CO2 in the atmosphere on Dec. 16 2023 📈 Up 5.90 from 417.31 ppm one year ago 📈🌎 @NOAA Mauna Loa data: 🌎 Daily: 🌎🙏 Pls. help make this global sustainability # visible 🙏
Tweet media one
27
153
238
@CO2_earth
CO2_Earth
3 months
🌎📈 426.21 ppm #CO2 in the atmosphere on Feb. 4 2024 📈 Up 6.18 from 420.03 ppm one year ago 📈🌎 @NOAA Mauna Loa data: 🌎 Daily: 🌎🙏 Pls. help make this global sustainability # visible 🙏
Tweet media one
14
144
229
@CO2_earth
CO2_Earth
1 year
🌍📈 🏆 We just pushed the atmosphere to a new RECORD HIGH for WEEKLY #CO2 😰 424.40 ppm CO2 at Mauna Loa (via Maunakea) in 17th week of 2023 🏆 Up 4.21 from 420.19 ppm a year ago 😰 @NOAA data 🌍 records 🌍
Tweet media one
69
163
210
@CO2_earth
CO2_Earth
4 months
📈 422.24 ppm #CO2 in the air for the planet in the 51st week of 2023 📈 Up from 419.05 one year ago📈 @NOAA Mauna Loa data: 🌎 distribution links: & 🌎
Tweet media one
36
137
210
@CO2_earth
CO2_Earth
1 year
🌎📈 424.72 ppm #CO2 in the atmosphere on May 6 2023 📈 Up 5.11 from 419.61 ppm one year ago 📈🌎 @NOAA Mauna Loa data via "MKO": 🌎 Daily: 🌎🙏 Pls. help make this global sustainability # visible 🙏
Tweet media one
9
119
196
@CO2_earth
CO2_Earth
11 months
🌍📈 🏆 New RECORD HIGH for WEEKLY #CO2 😰 424.64 ppm CO2 at Mauna Loa (via Maunakea) in the 22nd week of 2023 🏆 Up 2.93 from 421.71 ppm a year ago 😰 @NOAA data 🌍 records 🌍
Tweet media one
26
153
195
@CO2_earth
CO2_Earth
3 years
📈 414.19 ppm #CO2 in the atmosphere October 9, 2021 📈 Up from 411.10 ppm a year ago 📈 Mauna Loa Observatory @NOAA data & graphic: 📈 tracking:  🙏 View & share often 🙏
Tweet media one
5
103
181
@CO2_earth
CO2_Earth
2 months
🌎📈 426.10 ppm #CO2 in the atmosphere on Mar. 8 2024 📈 Up 5.36 from 420.74 ppm one year ago 📈🌎 @NOAA Mauna Loa data: 🌎 Daily: 🌎🙏 Pls. help make this global sustainability # visible 🙏
Tweet media one
12
144
181
@CO2_earth
CO2_Earth
1 year
🌎📈 424.76 ppm #CO2 in the atmosphere on May 5 2023 📈 Up 5.08 from 419.68 ppm one year ago 📈🌎 @NOAA Mauna Loa data via "MKO": 🌎 Daily: 🌎🙏 Pls. help make this global sustainability # visible 🙏
Tweet media one
18
104
173
@CO2_earth
CO2_Earth
11 months
🌎📈 424.76 ppm #CO2 in the atmosphere on May 29 2023 📈 Up 3.02 from 421.74 ppm one year ago 📈🌎 @NOAA Mauna Loa data via "MKO": 🌎 Daily: 🌎🙏 Pls. help make this global sustainability # visible 🙏
Tweet media one
32
110
171
@CO2_earth
CO2_Earth
2 years
📈 417.46 ppm #CO2 in the atmosphere for the last week of 2021 📈 Up from 415.32 ppm a year ago 📈 @NOAA Mauna Loa data: 📈 updates to check at  and for print: 📈
Tweet media one
8
130
168
@CO2_earth
CO2_Earth
1 year
🌍📈 🏆 It's another new RECORD HIGH for WEEKLY #CO2 😰 424.45 ppm CO2 at Mauna Loa (via Maunakea) in 18th week of 2023 🏆 Up 4.27 from 420.18 ppm a year ago 😰 @NOAA data 🌍 records 🌍
Tweet media one
50
129
155
@CO2_earth
CO2_Earth
2 months
🌎📈 425.27 ppm #CO2 in the atmosphere on Feb. 20 2024 📈 Up 5.43 from 419.84 ppm one year ago 📈🌎 @NOAA Mauna Loa data: 🌎 Daily: 🌎🙏 Pls. help make this global sustainability # visible 🙏
Tweet media one
9
99
157
@CO2_earth
CO2_Earth
11 months
🌎📈 424.03 ppm #CO2 in the atmosphere on May 25 2023 📈 Up 2.47 from 421.56 ppm one year ago 📈🌎 @NOAA Mauna Loa data via "MKO": 🌎 Daily: 🌎🙏 Pls. help make this global sustainability # visible 🙏
Tweet media one
14
80
156
@CO2_earth
CO2_Earth
2 months
🌎📈 425.28 ppm #CO2 in the atmosphere on Feb. 21 2024 📈 Up 5.44 from 419.84 ppm one year ago 📈🌎 @NOAA Mauna Loa data: 🌎 Daily: 🌎🙏 Pls. help make this global sustainability # visible 🙏
Tweet media one
15
122
156
@CO2_earth
CO2_Earth
1 year
🌍📈 🏆 Just in time for #EarthWeek we broke the RECORD HIGH for the WEEKLY CO2 AVERAGE 😰 422.89 ppm #CO2 at Mauna Loa in the 15th week of 2023 🏆 Up 2.99 from 419.90 a year ago 😰 @NOAA data: 🌍 records: 🌍
Tweet media one
30
116
156
@CO2_earth
CO2_Earth
11 months
🌎📈 424.46 ppm #CO2 in the atmosphere on Jun. 9 2023 📈 Up 3.13 from 421.33 ppm one year ago 📈🌎 @NOAA Mauna Loa data via "MKO": 🌎 Daily: 🌎🙏 Pls. help make this global sustainability # visible 🙏
Tweet media one
9
91
154
@CO2_earth
CO2_Earth
1 year
🌎📈 422.07 ppm #CO2 in the atmosphere on May 18 2023 📈 Up 1.91 from 420.16 ppm one year ago 📈🌎 @NOAA Mauna Loa data via "MKO": 🌎 Daily: 🌎🙏 Pls. help make this global sustainability # visible 🙏
Tweet media one
12
77
151
@CO2_earth
CO2_Earth
4 months
📈 421.86 ppm #CO2 in the planet's air in the last week of 2023 📈 Up from 419.41 one year ago📈 @NOAA Mauna Loa data: 🌎 distribution links: 🌎 Make 2024 a year to reduce global CO2 emissions deliberately!
Tweet media one
28
113
152
@CO2_earth
CO2_Earth
1 year
🌎📈 424.71 ppm #CO2 in the atmosphere on May 7 2023 📈 Up 5.33 from 419.38 ppm one year ago 📈🌎 @NOAA Mauna Loa data via "MKO": 🌎 Daily: 🌎🙏 Pls. help make this global sustainability # visible 🙏
Tweet media one
13
102
147
@CO2_earth
CO2_Earth
3 months
🌎📈 425.89 ppm #CO2 in the atmosphere on Feb. 6 2024 📈 Up a whopping 5.91 from 419.98 ppm one year ago 📈🌎 @NOAA Mauna Loa data: 🌎 Daily: 🌎🙏 Pls. help make this global sustainability # visible 🙏
Tweet media one
10
105
148
@CO2_earth
CO2_Earth
2 months
🌎📈 425.56 ppm #CO2 in the atmosphere on Mar. 14 2024 📈 Up 5.26 from 420.30 ppm one year ago 📈🌎 @NOAA Mauna Loa data: 🌎 Daily: 🌎🙏 Pls. help make this global sustainability # visible 🙏
Tweet media one
13
108
150
@CO2_earth
CO2_Earth
1 year
📈 424.09 ppm #CO2 in the atmosphere on April 18, 2023 📈 Up 3.22 from 420.87 ppm one year ago 📈 @NOAA Mauna Loa data & graphic 🌎 More info at 🙏 Please share this important signal to do better 🙏
Tweet media one
36
109
146
@CO2_earth
CO2_Earth
2 months
🌎📈 425.36 ppm #CO2 in the atmosphere on Mar. 7 2024 📈 Up 4.51 from 420.85 ppm one year ago 📈🌎 @NOAA Mauna Loa data: 🌎 Daily: 🌎🙏 Pls. help make this global sustainability # visible 🙏
Tweet media one
17
109
146
@CO2_earth
CO2_Earth
1 year
🌍 🏆📈 Atmospheric CO2 just hit an ALL TIME RECORD HIGH at Mauna Loa 🏆😰 423.06 ppm on Apr 11 2023 😰🏆 Up 4.24 ppm from 418.82 one year ago 😰 Daily data live from the @NOAA : 🌍 🙏 Track records: 🙏 🌍
Tweet media one
8
107
144
@CO2_earth
CO2_Earth
1 year
🌎📈 424.49 ppm #CO2 in the atmosphere on May 16 2023 📈 Up 2.77 from 421.72 ppm one year ago 📈🌎 @NOAA Mauna Loa data via "MKO": 🌎 Daily: 🌎🙏 Pls. help make this global sustainability # visible 🙏
Tweet media one
19
94
143
@CO2_earth
CO2_Earth
3 years
May #2021 be a watershed year when people at all levels of our societies get comfortable (as @GretaThunberg is) with knowing the problem (biosphere getting less habitable) and calling on the need to modify systems that perpetuate it. Lives, liberties & legacies are at stake.
@GretaThunberg
Greta Thunberg
3 years
My name is Greta Thunberg and I am inviting you to be a part of the solution. As #ParisAgreement turns 5, our leaders present their 'hopeful' distant hypothetical targets, 'net zero' loopholes and empty promises. But the real hope comes from the people. #FightFor1Point5
9K
15K
68K
4
34
135
@CO2_earth
CO2_Earth
2 years
📈 418.44 ppm #CO2 in the atmosphere December 24, 2021 📈 Up from 414.90 ppm a year ago 📈 Mauna Loa Observatory @NOAA data & graphic: 📈 tracking:  🙏 View & share often 🙏
Tweet media one
5
110
136
@CO2_earth
CO2_Earth
5 months
🌎📈 422.36 ppm #CO2 in the atmosphere on Nov. 18 2023 📈 Up 4.81 from 417.55 ppm one year ago 📈🌎 @NOAA Mauna Loa data: 🌎 Daily: 🌎🙏 Pls. help make this global sustainability # visible 🙏
Tweet media one
6
94
139
@CO2_earth
CO2_Earth
1 month
📈 425.74 ppm #CO2 in the air for the planet in the 11th week of 2024 📈 Up 5.66 ppm from 420.08 one year ago📈 @NOAA Mauna Loa data: 🌎 distribution: & 🌎
Tweet media one
6
76
139
@CO2_earth
CO2_Earth
1 year
@pawelroszyk @NOAA The location at 3400 m in the middle of the largest ocean is well established as an outstanding location for getting air samples with clean background air.
5
3
133
@CO2_earth
CO2_Earth
1 year
🌎📈 424.27 ppm #CO2 in the atmosphere on May 15 2023 📈 Up 2.43 from 421.84 ppm one year ago 📈🌎 @NOAA Mauna Loa data via "MKO": 🌎 Daily: 🌎🙏 Pls. help make this global sustainability # visible 🙏
Tweet media one
20
73
129
@CO2_earth
CO2_Earth
1 year
424.03 parts per million (ppm) CO2 in air 16-Apr-2023. First >424 reading in Keeling Curve record. Highest recorded reading at Mauna Loa Observatory.
26
96
130
@CO2_earth
CO2_Earth
1 year
@Claudiokollera @NOAA Actually, the atmosphere, land surface and oceans are capturing more CO2 than they used to, say, a decade or a century ago. But the removal of massive amounts of C sequestered in the Earth's crust is forcing a cascade of changes through the climate system and biosphere.
8
15
128
@CO2_earth
CO2_Earth
1 year
📈 424.29 ppm #CO2 in the air at Maunakea for the 19th week of 2023 📈 Up from 420.75 ppm one year ago📈 @NOAA Mauna Loa data via 'MKO': 📈🌎 links: & & 🌎
Tweet media one
25
87
123
@CO2_earth
CO2_Earth
1 year
🌍 🏆📈 Humankind broke a new ALL-TIME record in the WEEKLY CO2 AVERAGE in the 14th week of 2023 🏆😰 422.60 ppm at Mauna Loa 😰🏆 Up 2.31 ppm from 420.29 a year ago 😰 @NOAA live data: 🌍 Track records: 🌍
Tweet media one
6
107
124
@CO2_earth
CO2_Earth
1 year
🌎📈 423.64 ppm #CO2 in the atmosphere on Apr. 24 2023 📈 Up 4.23 from 419.41 ppm one year ago 📈🌎 @NOAA Mauna Loa data via "MKO": 🌎 Daily: 🌎🙏 Pls. help make this global sustainability # visible 🙏
Tweet media one
6
70
122
@CO2_earth
CO2_Earth
5 years
🏆📈🏆 413.45 parts per million (ppm) #CO2 in atmosphere on January 12, 2019 🏵️🏵️ HIGHEST EVER daily average reported from Mauna Loa 🏵️🏵️ #NOAA source data and graphic: 🔗 🏵️🏵️ Daily records tracked at
Tweet media one
24
142
110
@CO2_earth
CO2_Earth
9 months
📈 422.53 ppm #CO2 in the air at Maunakea for the 30th week of 2023 📈 Up from 418.03 a year ago📈 @NOAA Mauna Loa data via 'MKO': 📈🌎 links: & & 🌎
Tweet media one
5
93
121
@CO2_earth
CO2_Earth
1 month
🌎📈 426.26 ppm #CO2 in the atmosphere on Mar. 23 2024 📈 Up 5.51 from 420.75 ppm one year ago 📈🌎 @NOAA Mauna Loa data: 🌎 Daily: 🌎 🙏 Please help keep the 350 overshoot brief 🙏
Tweet media one
29
73
118
@CO2_earth
CO2_Earth
1 year
🌎📈 423.23 ppm #CO2 in the atmosphere on Apr. 22 2023 📈 Up 4.10 from 419.13 ppm one year ago 📈🌎 @NOAA Mauna Loa data: 🌎 Daily: 🌎🙏 Let's make our global sustainability number visible & actionable 🙏
Tweet media one
12
73
119
@CO2_earth
CO2_Earth
2 years
📈 418.33 ppm #CO2 in the Earth's air for week 2 of 2022 📈 Up from 415.06 a year ago 📈 @NOAA Mauna Loa data: 📈 updates at & to share in print: 📈
Tweet media one
7
83
112
@CO2_earth
CO2_Earth
2 years
📈 Monthly average #CO2 in the atmosphere was 413.93 ppm in October 2021. 📈 Up from 411.41 ppm in October 2020. 📈 Mauna Loa Observatory @NOAA data. 🙏 Track and share this important CO2 signal for the world to see! 🙏
Tweet media one
2
98
111
@CO2_earth
CO2_Earth
3 years
📈 418.46 ppm #CO2 in the atmosphere March 20, 2021 📈 Up from 414.34 ppm a year ago 📈 Mauna Loa Observatory @NOAA data & graphic: 📈 tracking:  🙏 View & share often 🙏
Tweet media one
5
86
115
@CO2_earth
CO2_Earth
1 year
🌎📈 424.78 ppm #CO2 in the atmosphere on Apr. 25 2023 📈 Up 3.99 from 420.79 ppm one year ago 📈🌎 @NOAA Mauna Loa data via "MKO": 🌎 Daily: 🌎🙏 Pls. help make this global sustainability # visible 🙏
Tweet media one
10
69
116
@CO2_earth
CO2_Earth
2 years
📈 417.44 ppm #CO2 in the atmosphere December 25, 2021 📈 Up 2.63 ppm from 414.81 ppm the previous #Christmas day 📈 Mauna Loa Observatory @NOAA data & graphic: 📈 tracking:  🙏 View & share often 🙏
Tweet media one
4
68
113
@CO2_earth
CO2_Earth
3 months
🏆📈🏆 425.83 ppm #CO2 in the air for the 6th week of 2024 🏆📈🏆 NEW RECORD HIGH FOR WEEKLY CO2 🏆📈🏆 Up from 420.08 a year ago 🌎 @NOAA Mauna Loa data: 🌎 See & show data: & 🌎
Tweet media one
5
89
115
@CO2_earth
CO2_Earth
11 months
🌎📈 424.72 ppm #CO2 in the atmosphere on Jun. 3 2023 📈 Up 3.15 from 421.57 ppm one year ago 📈🌎 @NOAA Mauna Loa data via "MKO": 🌎 Daily: 🌎🙏 Pls. help make this global sustainability # visible 🙏
Tweet media one
10
73
112
@CO2_earth
CO2_Earth
1 year
📈424.03 ppm #CO2 in the atmosphere on Apr 16 2023 📈 Up 2.72 from 421.31 ppm one year ago @ Mauna Loa 📈 @Scripps_Ocean @Keeling_curve data 📈 updates 📈🚫 @NOAA MLO CO2 data unavailable for Apr 16 2023 🚫
Tweet media one
28
61
110
@CO2_earth
CO2_Earth
1 year
🌎📈 424.31 ppm #CO2 in the atmosphere on May 14 2023 📈 Up 2.27 from 422.04 ppm one year ago 📈🌎 @NOAA Mauna Loa data via "MKO": 🌎 Daily: 🌎🙏 Pls. help make this global sustainability # visible 🙏
Tweet media one
15
55
109
@CO2_earth
CO2_Earth
4 months
🌎📈 424.96 ppm #CO2 in the atmosphere on Jan. 13 2024 📈 Up 4.23 from 420.73 ppm one year ago 📈🌎 @NOAA Mauna Loa data: 🌎 Daily: 🌎🙏 Pls. help make this global sustainability # visible 🙏
Tweet media one
3
86
111
@CO2_earth
CO2_Earth
11 months
🌎📈 423.68 ppm #CO2 in the atmosphere on May 20 2023 📈 Up 2.99 from 420.69 ppm one year ago 📈🌎 @NOAA Mauna Loa data via "MKO": 🌎 Daily: 🌎🙏 Pls. help make this global sustainability # visible 🙏
Tweet media one
8
59
108
@CO2_earth
CO2_Earth
1 month
🌎📈 426.35 ppm #CO2 in the atmosphere on Mar. 24 2024 📈 Up 5.53 from 420.82 ppm one year ago 📈🌎 @NOAA Mauna Loa data: 🌎 Daily: 🌎 🙏 Please help keep the 350 overshoot brief 🙏
Tweet media one
14
73
109
@CO2_earth
CO2_Earth
11 months
📈 423.91 ppm #CO2 in the air at Maunakea for the 21st week of 2023 📈 Up from 421.31 a year ago📈 @NOAA Mauna Loa data via 'MKO': 📈🌎 links: & & 🌎
Tweet media one
11
70
105
@CO2_earth
CO2_Earth
2 years
📈 418.96 ppm #CO2 in the atmosphere January 23, 2022 📈 Up from 416.40 ppm a year ago 📈 Mauna Loa Observatory @NOAA data & graphic: 📈 tracking:  🙏 View & share often 🙏
Tweet media one
1
66
103
@CO2_earth
CO2_Earth
1 year
🌎📈 424.34 ppm #CO2 in the atmosphere on Apr. 26 2023 📈 Up 2.28 from 422.06 ppm one year ago 📈🌎 @NOAA Mauna Loa data via "MKO": 🌎 Daily: 🌎🙏 Pls. help make this global sustainability # visible 🙏
Tweet media one
5
65
101
@CO2_earth
CO2_Earth
1 month
🌎📈 426.36 ppm #CO2 in the atmosphere on Mar. 16 2024 📈 Up 6.12 from 420.24 ppm one year ago 📈🌎 @NOAA Mauna Loa data: 🌎 Daily: 🌎 🙏 Please help keep the 350 ppm overshoot brief 🙏
Tweet media one
2
59
104
@CO2_earth
CO2_Earth
11 months
📈 424.13 ppm #CO2 in the air at Maunakea for the 24th week of 2023 📈 Up from 421.05 a year ago📈 @NOAA Mauna Loa data via 'MKO': 📈🌎 links: & & 🌎
Tweet media one
10
84
99
@CO2_earth
CO2_Earth
24 days
🌎📈 426.71 ppm #CO2 in the atmosphere on Apr. 5 2024 📈 Up 4.02 from 422.69 ppm one year ago 📈🌎 @NOAA Mauna Loa data: 🌎 Daily: 🌎 🙏 Please help keep this 350 overshoot brief 🙏
Tweet media one
4
76
102
@CO2_earth
CO2_Earth
3 years
Gwynne Dyer writes, "Get ready for wave after wave of historic heat" in @KamThisWeek . Dyer reports on an emerging Wave 5 / Wave 7 hypothesis regarding long and wide heat waves--like last week in the Pacific Northwest. ARTICLE:
Tweet media one
5
53
98
@CO2_earth
CO2_Earth
3 months
🌎📈 425.60 ppm #CO2 in the atmosphere on Feb 7 2024 📈 A big jump of 6.14 from 419.46 ppm one year ago 📈🌎 @NOAA Mauna Loa data: 🌎 Daily: 🌎🙏 Together we can make this global sustainability # visible 🙏
Tweet media one
10
65
102
@CO2_earth
CO2_Earth
2 years
🏵️🏵️ HIGHEST-EVER weekly #CO2 level in the atmosphere with human on Earth! 🏵️🏵️ 📈 421.46 ppm in 21st week of 2022 📈 Up from 418.76 a year ago 📈 @NOAA MLO data: 📈 🌍 records: 🌍
Tweet media one
5
98
99
@CO2_earth
CO2_Earth
1 year
🌎📈 422.39 ppm #CO2 in the atmosphere on May 19 2023 📈 Up 2.10 from 420.29 ppm one year ago 📈🌎 @NOAA Mauna Loa data via "MKO": 🌎 Daily: 🌎🙏 Pls. help make this global sustainability # visible 🙏
Tweet media one
8
49
96
@CO2_earth
CO2_Earth
1 year
🌎📈 424.26 ppm #CO2 in the atmosphere on May 8 2023 📈 Up 4.44 from 419.82 ppm one year ago 📈🌎 @NOAA Mauna Loa data via "MKO": 🌎 Daily: 🌎🙏 Pls. help make this global sustainability # visible 🙏
Tweet media one
10
72
98
@CO2_earth
CO2_Earth
2 months
📈 425.45 ppm #CO2 in the air for the planet in the 10th week of 2024 📈 Up from 421.44 one year ago📈 @NOAA Mauna Loa data: 🌎 distribution links: & 🌎
Tweet media one
6
83
101