
Generating or engineering features from Time Series data when using an ML approach involves extracting meaningful information that can be used by algorithms to understand patterns, make predictions, or identify trends.
Here are some feature engineering techniques 🧵👇
15
90
325
Replies
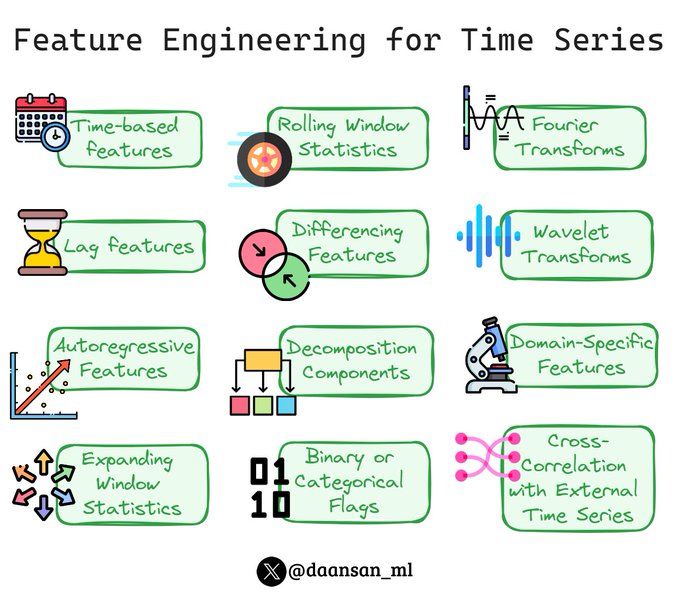
▶️ Time-Based Features:
Extracting features like hour, day, week, month, year, or season can be very informative, especially if the time series shows periodicity or seasonality.
1
0
6
▶️ Lag Features:
These are values at previous time steps. For instance, the value of a time series at time t-1, t-2, etc., can be used as a feature to predict the value at time t.
1
0
5
▶️ Rolling Window Statistics:
Calculate statistics (mean, median, variance, etc.) over a rolling window. This helps in capturing trends and patterns over specified time intervals.
1
1
6
▶️ Expanding Window Statistics:
Similar to rolling windows but the window size increases over time, providing cumulative statistics.
1
0
5
▶️ Differencing Features:
This involves calculating the difference between two consecutive observations. This can help in removing trends and seasonality.
1
0
5
▶️ Fourier Transforms:
To capture cyclical patterns, Fourier transforms can be used to extract periodic frequencies and amplitudes.
1
0
5
▶️ Wavelet Transforms:
Useful for capturing both frequency and location information in your time series data, particularly for non-stationary time series.
1
0
5
▶️ Autoregressive Features:
These features come from models that use a combination of past values to predict future values, like ARIMA models.
1
1
6
▶️ Decomposition Components:
Decompose time series into trend, seasonal, and residual components. Each of these components can be used as separate features.
1
0
4
▶️ Domain-Specific Features:
Depending on the specific domain (finance, weather, etc.), certain features might be more relevant, like holiday effects in sales data.
1
0
4
▶️ Binary or Categorical Flags:
Create flags or categorical variables for specific events or conditions (e.g., weekends, holidays, events).
1
0
5
▶️ Cross-Correlation with External Time Series:
Sometimes, the relationship between two time series can be a feature, especially if one series can be predictive of another.
1
0
4
Each of these techniques can bring out different aspects of the time series data, and the choice of features often depends on the specific problem and the nature of the data you're working with.
1
0
4
Join more than 4k 💊MLPills subscribers and enjoy free Machine Learning and Data Science content straight to your email every Thursday!

1
0
4
You should also join our newsletter, DSBoost🚀
Every week we share:
🔹Interviews
🔹Podcast notes
🔹Learning resources
🔹Interesting collections of content
Subscribe for free👇👇

0
0
3


