
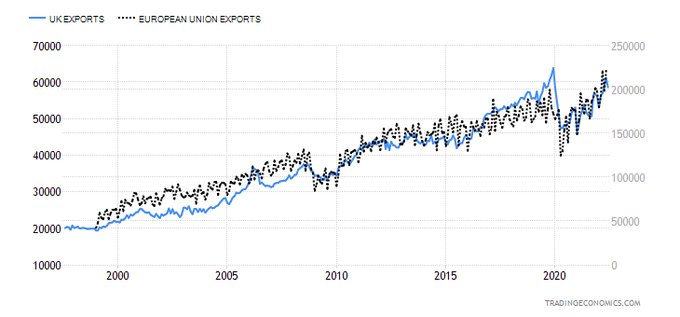
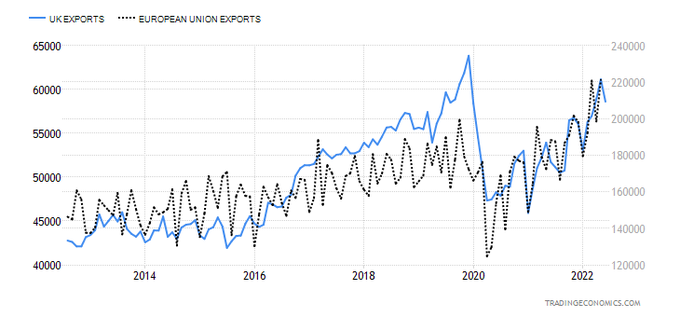
Here is the same chart over 25 years.
you will note that the only period in that time when UK exports outperformed EU exports was the period 2016-2020. After the Brexit vote (largely because of the devaluation of the pound)
3
33
196
Replies
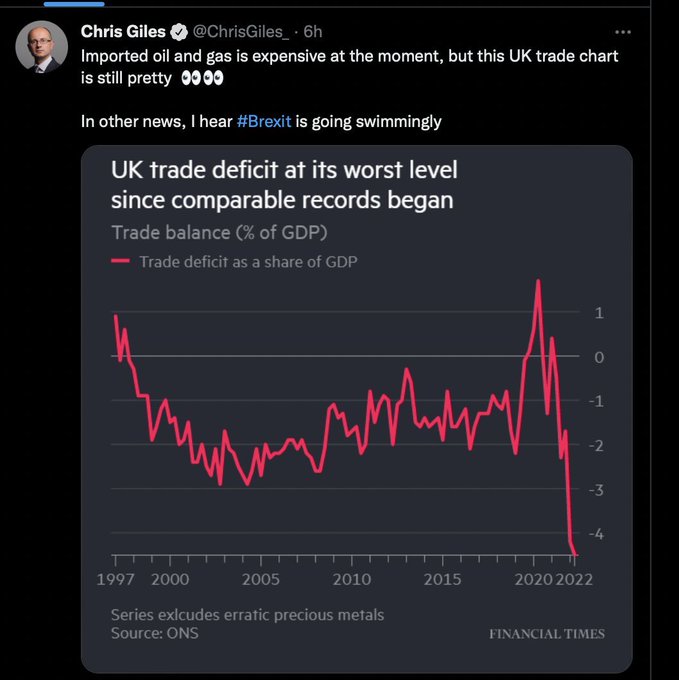
This morning
@chrisgiles_
of the
@FT
sent out this tweet on the UK's deteriorating trade balance suggesting that this was a result of Brexit (apologies for the screenshot but I cannot link to the original tweet because he immediately blocked me after the following reply)
92
407
921
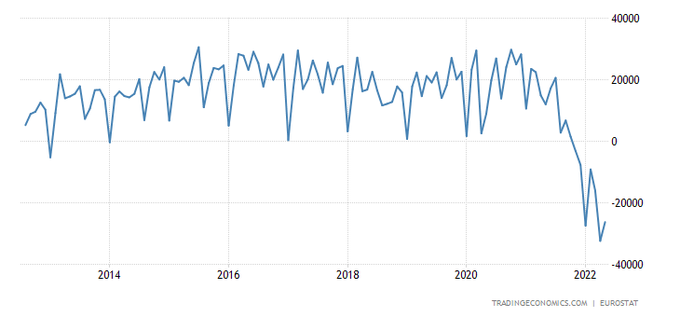
I replied with the following chart demonstrating that this is a Europe wide issue and a result of the rise in the price of oil and gas imports and asking him why as Economics Editor of the
@FT
for 14 years he either didn't know this or was he purposely misrepresenting the facts?
15
95
505
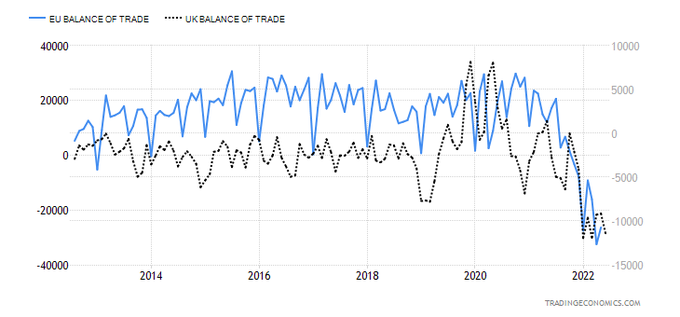
Below I show the a chart comparing the UK and EU net trade performance over the past decade. As you can see the trend is exactly the same (although the EU started from a position of surplus) demonstrating that this is a function of oil and gas prices/imports and not Brexit.
8
85
369
Note the UK shift to a trade surplus in 2019/20 due to covid and the return to deficit in 2021 as the global economy re-opened (which some commentators have tried to ascribe to a Brexit effect post the end of the transition period).
1
31
199
There has been much reporting of this nature in recent months intended to create the impression that Brexit is causing a collapse in UK exports and feeding inflation. This is simply not true, so for that reason I decided to make this thread to counter this misinformation.
3
47
257
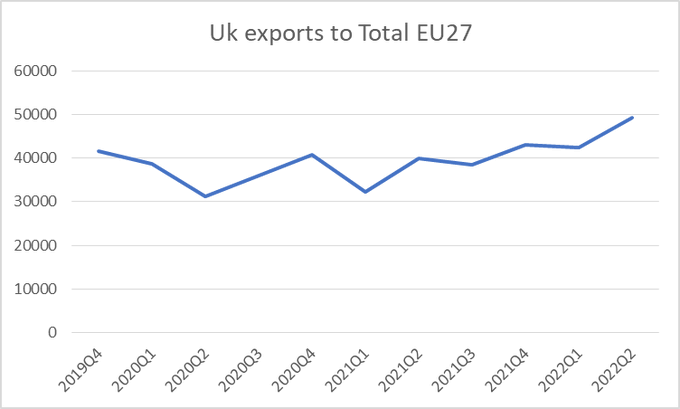
First on UK exports to the EU. It is claimed they have collapsed since the end of the transition period. This is demonstrably false. Here is a chart using ONS data
12
70
282
This chart also disproves the argument UK export performance has been worse than EU.
It compares UK exports with EU exports over the last decade.
NB the outperformance of the UK since the 2016 brexit referendum vote.
NB the broadly matched performance post 2020 (covid) & TCA.
4
49
212
But that is not all
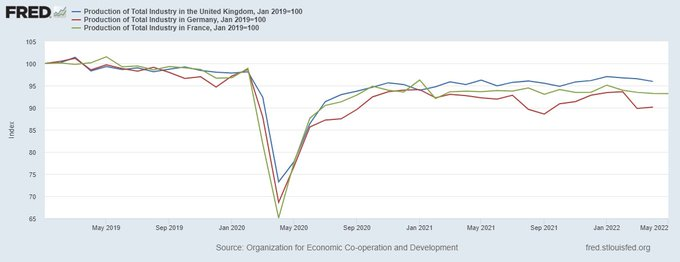
One of the expected effects of Brexit, was increased capture of UK consumption by UK based businesses (incl reshoring). The data suggests that this is happening as shown below where UK industrial production since 2019 has outpaced Germany & France
2
43
208
In other words, the export data (which does not show any post brexit collapse) is not the full picture because we should expect supply chain reversions as a result of the increased trade barriers from the UK leaving the SM & CU.
2
23
150
And considering the UK went from a trade surplus with the EU before the advent of the SM to a £100b pa goods trade deficit, we would expect any reversion to be on balance in the UK's benefit.
Which is exactly what the data appears to be demonstrating
4
26
183
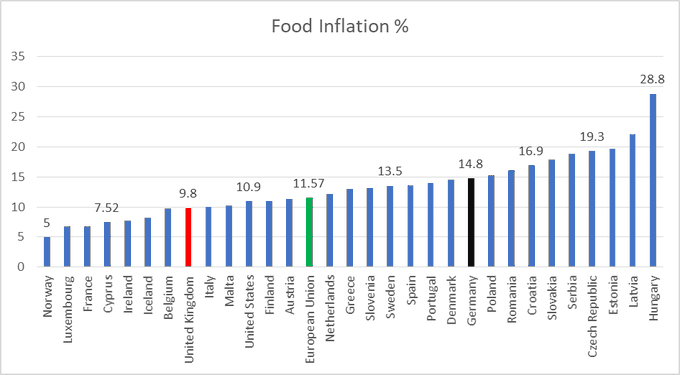
As for inflation.
Many claims have been made that the UK is suffering higher food inflation as a result of Brexit.
well that is NOT what the data shows
10
65
247
In short, please take with a huge bucket of salt recent claims of the negative effects of Brexit on the UK economy. They are being pushed by those with an anti Brexit agenda and are not reflective of the underlying data.
41
78
477