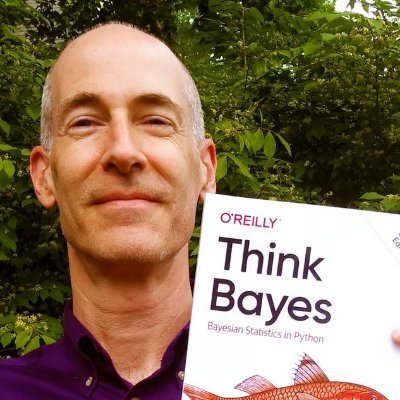
Allen Downey
@AllenDowney
17,207
Followers
1,095
Following
905
Media
7,875
Statuses
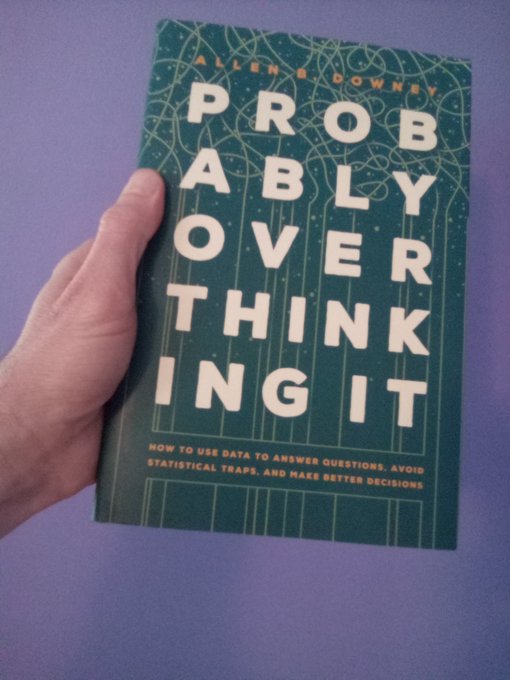
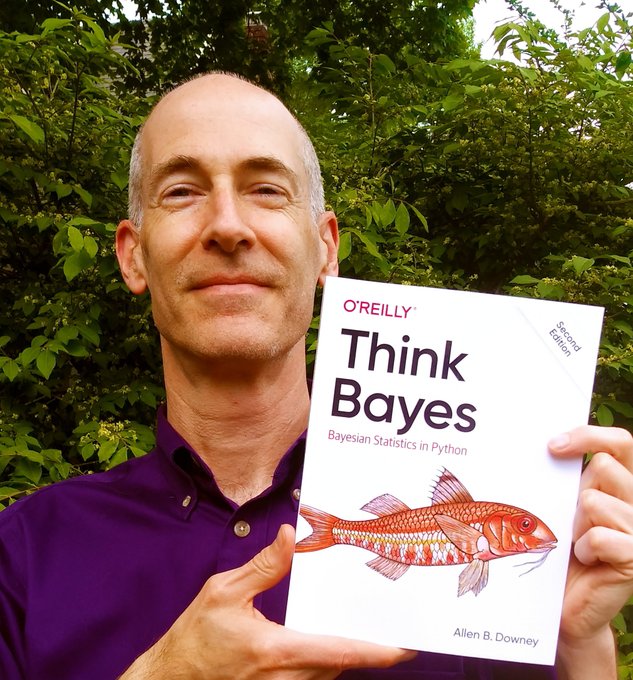
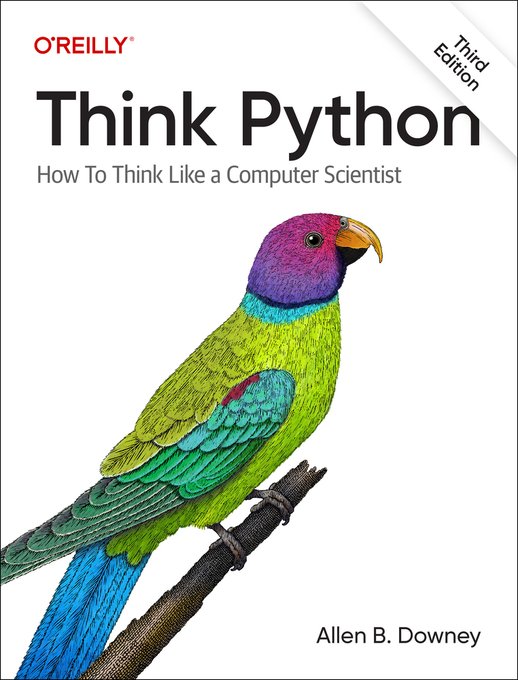
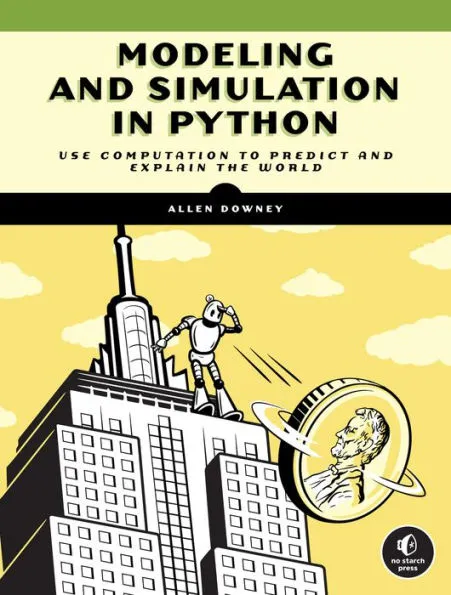
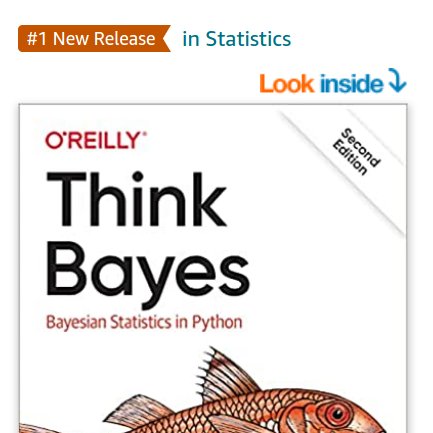
Author of Probably Overthinking It, Think Python, and Think Bayes. Emeritus Prof at Olin College, consultant with PyMC Labs.
Don't wanna be here?
Send us removal request.