
Someone (
@chris_whong
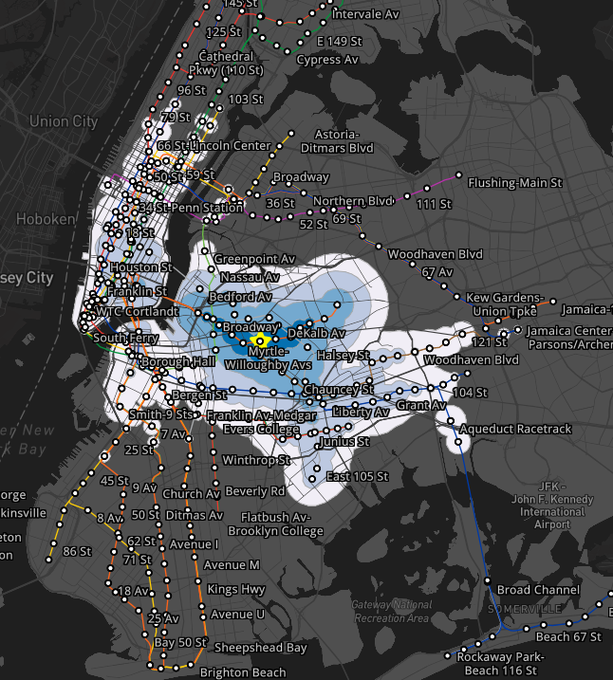
) ran the watershed algorithm on walking + commute graphs in NYC, and it's the highest information value visualization I've seen in a long time
2
14
152
Replies
@chris_whong
This image also explains the natural defensive moat that Bushwick has from Columbia undergrads. Thank jah
0
1
13

@omershapira
@chris_whong
Did a similar project for my undergrad application. Laser cut 5 10 15m walking distance on to acrylic
2nd project:
I parted ways with the og project but kept one of the test pieces, gotta dig that back up 🤔
0
0
0