
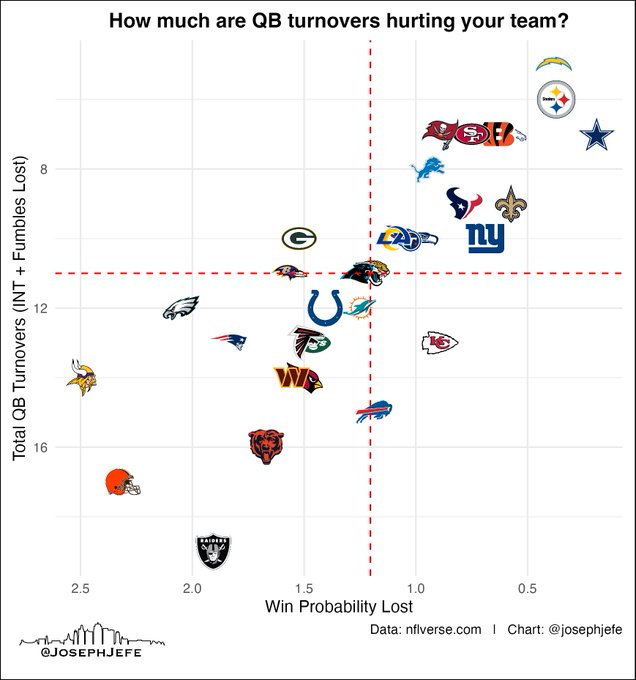
How much are turnovers caused by the QB hurting your team overall?
This is every interception + fumble lost by a QB for each team, and the sum total of Win Probability that has been lost by each team from them.
Top right means few interceptions, and not much pain.

@josephjefe
this raises the idea that a scatter plot of qb turnovers vs wp lost would be pretty interesting
1
0
4
29
74
338
Replies
Top right means fewer *turnovers*, not fewer interceptions, though INT's are more common than QB fumbles, so it's likely still correct.
1
3
17
Should also note that the Win Probability Lost axis should be in percentages, so 1.5 means 150%, or a game and a half of win probability lost. I'll correct this in a future graphic.
1
0
7
Here's 2022, for those who care.
Here's total QB turnovers vs win probability lost on QB turnovers for 2022.
Rams and Cardinals outliers with lots of turnovers, but not too impactful.
Bills also outliers with just how much it cost them.

2
2
2
0
1
8


@josephjefe
So if I understand correctly: top right are the virtuoso teams while bottom left the exact opposite.
Bottom right a lot of turnovers but not much pain while top left means few costly turnovers.
1
0
2

@josephjefe
So if Jalen Hurts didn't have any turnovers the Eagles would be 11 and -1. Go birds
1
0
1

@josephjefe
@JohnPGilbertNFL
Interesting that Mahomes is: turns over a lot, doesn't matter that much (this probably means many of the interceptions are arm punts). Love is the opposite: not many turnovers, but they have an oversized impact.
0
0
1


@josephjefe
@willie_lutz
I guess these are simple enough numbers but I refuse to believe Josh Allen is that low
2
0
0


@josephjefe
Jalen Hurts is hurting his team more than helping them, but he’s the MVP favorite?
Makes a ton of sense!
1
0
2


