Tableau Public Profile Banner
Tableau Public Profile
Tableau Public

@tableaupublic

69,844
Followers
1,265
Following
2,109
Media
5,531
Statuses

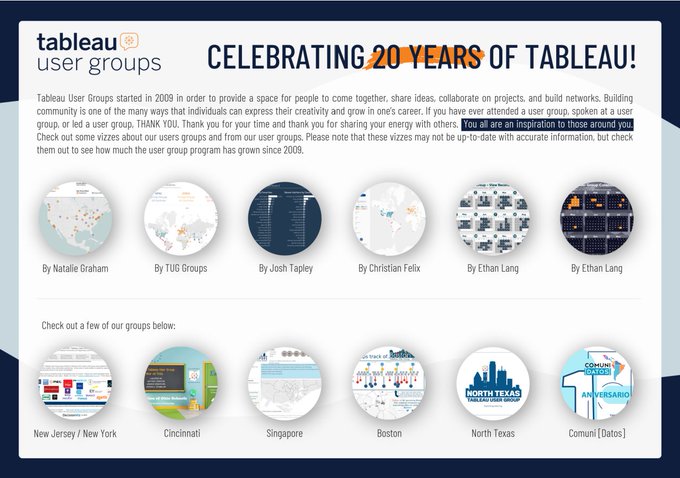
Share, create, and explore @Tableau data visualizations for free on Tableau Public. For more inspiration, view our #VizOfTheDay and connect with our #DataFam ❤️

United States
Joined March 2012
Don't wanna be here? Send us removal request.
Pinned Tweet
@tableaupublic
Tableau Public
10 months
Seeking data visualization and dashboard experts for your team? 📊 Look no further! This data viz will connect you with Tableau professionals who are #OpenToViz .
6
18
137
@tableaupublic
Tableau Public
4 years
Tableau Public was founded 10 years ago, allowing people from around the world to share and consume the most important data stories of our time. Thank you, #DataFam for 10 years of sharing, learning, and inspiring. Celebrate with us by tagging someone that’s inspired you below 👇
Tweet media one
100
50
314
@tableaupublic
Tableau Public
4 years
During these unprecedented times, we’re working to ensure that everyone has access to trustworthy data. Head to our #COVID19 Data Resource Hub to get trusted data, workbooks, and vizzes that can help you stay informed:
33
91
276
@tableaupublic
Tableau Public
5 months
That’s a viz wrap, #DataFam ! As 2023 comes to an end, dive into a curated collection of compelling data visualizations on Tableau Public. Explore the stories, insights, and creativity that defined this year.
21
63
161
@tableaupublic
Tableau Public
4 years
Congratulations to this year's #IronViz Champion @thecfelix ! 🏆Explore this #VOTD to learn about the correlation between breathing air inequality and wealth inequality:
Tweet media one
5
28
241
@tableaupublic
Tableau Public
4 years
Tableau Public's newest feature allows you to explore a viz directly in the browser! By clicking the ‘Explore’ button you can easily see how a viz was built and even create your own version. Head to the blog to learn more 👉:
18
59
227
@tableaupublic
Tableau Public
5 years
Tired of the same old KPI visualizations? This #VOTD by @adamemccann shows 20 KPI options listed with pros and cons. Download the viz and learn how to recreate each one:
2
54
204
@tableaupublic
Tableau Public
2 years
Do you know what side of the road most countries drive on? See @AdedamolaLadipo data visualization to find out. Viz inspired by @juditbekker and @theneilrichards .
Tweet media one
16
25
208
@tableaupublic
Tableau Public
3 years
Bangalore, also known as the Silicon Valley of India, has been the number one technology hub since the '90s which has led to quick development and high demand for properties. Explore this #VOTD by @kizley to see the city's residential hotspots:
Tweet media one
24
17
198
@tableaupublic
Tableau Public
1 year
In this #VizOfTheDay , @LillaRasztik compiles a collection of resources from the #DataFam that will show you how to create various chart types.
Tweet media one
7
27
197
@tableaupublic
Tableau Public
4 years
#IronViz is back for 2020 and the prizes are bigger than ever! Don't miss this opportunity to challenge yourself and compete with data enthusiasts from around the world. Head to the blog to learn more👉:
9
65
193
@tableaupublic
Tableau Public
1 year
In this #VizOfTheDay , @imagineazhar visualizes life expectancy around the world. The chord diagram was inspired by 2022 Iron Viz finalist @_CJMayes .
Tweet media one
13
12
191
@tableaupublic
Tableau Public
3 years
Who's your favorite character from The Wire? Explore this #VOTD by @MatthewAntoline to see screen time comparisons among 100 of the most memorable characters from David Simon's crime drama television series:
Tweet media one
18
11
191
@tableaupublic
Tableau Public
3 years
Hey #DataFam ! Introducing our newest group of Featured Authors—recent graduates from the Millennials and Data Analyst Boot Camp 🤩 These data rockstars are crushing it!:
38
35
188
@tableaupublic
Tableau Public
3 years
Business-style dashboards can be beautiful and informative too! 📊 Check out this #VOTD by @ellenblackburnn which succinctly visualizes wealth and personal banking data.
Tweet media one
13
19
189
@tableaupublic
Tableau Public
4 years
Introducing our newest group of Featured Authors! 🤩 As we navigate these challenging times, it can be difficult to stay connected—follow these Tableau Public authors and show them some #DataFam love:
18
32
186
@tableaupublic
Tableau Public
5 years
In honor of @tableau community founder and Zen Master Kelly Martin ( @VizCandy ), we are sharing one of the most influential vizzes for #VOTD . We extend our deepest condolences to her loved ones and the #DataFam :
Tweet media one
4
51
183
@tableaupublic
Tableau Public
1 year
This executive-focused business dashboard #VizOfTheDay by @im_akeelah showcases yearly KPIs. It uses marks layers and was inspired by the work of fellow Tableau Public authors @ellenblackburnn and @lukestanke .
Tweet media one
16
17
180
@tableaupublic
Tableau Public
3 years
Did you know that over 10,000 musical acts can be traced back to just a handful of influential artists? Take a look at this #VOTD by @BMooreWasTaken to learn how music’s greatest influencers shaped the music landscape:
Tweet media one
28
19
180
@tableaupublic
Tableau Public
9 months
A record 8 million data vizzes are now on Tableau Public, #DataFam ! ✨ Explore the top 8 most-favorited of all time:
2
42
173
@tableaupublic
Tableau Public
2 years
Check out this business-style dashboard #IronQuest #VOTD by @pradeep_zen which concisely visualizes web traffic data from a digital marketing perspective.
Tweet media one
16
10
171
@tableaupublic
Tableau Public
3 years
To celebrate #WomensHistoryMonth , we're recognizing the work of some amazing women who inspire others within our community—meet our newest group of Featured Authors!
30
41
173
@tableaupublic
Tableau Public
5 months
Check out Isabel's #VizOfTheDay for effective survey data visualization, showcasing Likert Scales—a method to measure opinions through graded agreement-disagreement responses.
Tweet media one
3
19
171
@tableaupublic
Tableau Public
2 years
This Real World Fake Data #RWFD #VOTD Human Resources dashboard by @pradeep_zen —based on a Tableau Accelerator—illustrates a company’s retention and attrition rates, survey results, job roles and more.
Tweet media one
9
10
169
@tableaupublic
Tableau Public
4 years
Did you know that Ursa Major is the most visible constellation? Check out this #VOTD by @ritz_Tableau to learn about constellations named after Greek and Roman myths:
Tweet media one
34
24
164
@tableaupublic
Tableau Public
1 year
Learn 12 ways data distributions can be visualized in this Back to Viz Basics #B2VB entry #VizOfTheDay by @KevinWee90 —including box plots, histograms, beeswarm plots, and more. To learn more about each chart, click the expand icon on each card.
Tweet media one
12
19
165
@tableaupublic
Tableau Public
4 years
Who wrote The Beatles' most popular songs? 🎶 Explore this #VOTD by @SmilgaNir to learn which band member wrote the lyrics to your favorite track:
Tweet media one
14
22
163
@tableaupublic
Tableau Public
2 years
Did you know that 221 vizzes were featured as a Viz of the Day #VOTD last year? But there were so many more we loved that we've gathered a few additional great vizzes from 2021 in our latest blog post 🤩! We hope these inspire you in 2022 and beyond.
24
36
157
@tableaupublic
Tableau Public
3 years
In search of inspiration for your next viz? Go follow our new group of Featured Authors! 🤩 Their work will blow you away.
21
22
162
@tableaupublic
Tableau Public
4 years
Where is Lebron James most lethal on the court? In this #SportsVizSunday #VOTD , @ZaksViz looks at the location and accuracy of shot attempts in the NBA. Check it out:
Tweet media one
29
21
158
@tableaupublic
Tableau Public
1 year
In celebration of 20 years of @tableau , this #VizOfTheDay by Tableau Visionary @FlerlageKev shares a collection of #TableauUserGroup vizzes that show the impact of TUGs since their inception in 2009.
Tweet media one
24
21
161
@tableaupublic
Tableau Public
3 years
Did you know that Nutella was created accidentally by Italian baker, Pietro Ferrero? Explore this #VOTD by @Ali15Tehrani to learn more about the history of Nutella 🍫:
Tweet media one
19
17
160
@tableaupublic
Tableau Public
3 years
Singapore is a relatively young country that has rapidly grown since its independence from Malaysia 56 years ago. Check out @minttea102 's #VOTD leveraging our new map layers feature which highlights the country's population, housing, and infrastructure:
Tweet media one
35
15
159
@tableaupublic
Tableau Public
1 month
Visualize your KPIs. 💡 Elevate your business dashboard with inspiration from this #VizOfTheDay created by Kajal Kadam. This viz showcases 16 dynamic approaches to KPIs →
Tweet media one
0
21
158
@tableaupublic
Tableau Public
4 years
Join us in giving a round of applause to the latest cohort of Featured Authors! 👏 Be sure to follow each of these data rockstars on Tableau Public to stay up with their latest work:
20
19
157
@tableaupublic
Tableau Public
1 year
En-viz-ion this! Tableau Public now has Sankey and radial charts as part of a New Chart Types Pilot. Explore best practices for using Sankey and radial charts with Tableau Visionary @sarahlovesdata , and join the pilot now through June 30. ➡️
10
35
155
@tableaupublic
Tableau Public
3 years
#VizforSocialGood connects nonprofits with data professionals who are passionate about using their skills for good. Explore this #VOTD by @SParsonsDataViz to learn how @VizFSG volunteers are empowering nonprofit organizations through data storytelling:
Tweet media one
18
10
156
@tableaupublic
Tableau Public
4 years
Approximately 22% of Black Americans are living in poverty. In this #ProjectHealthViz #VOTD , @ZenDollData looks at poverty rates in counties across the United States. Dive in to learn more:
Tweet media one
37
17
153
@tableaupublic
Tableau Public
3 years
Hey, #DataFam ! We just hit 2 million data visualization authors 🎉 Read our blog post to learn more about the largest repository of data visualizations in the world and learn new data skills.
12
25
155
@tableaupublic
Tableau Public
4 years
Congratulations to the three #IronViz finalists @SimonBeaumont04 , @jusdespommes , and @thecfelix ! 🎉 Head to the blog post to see their awe-inspiring entries:
Tweet media one
11
21
153
@tableaupublic
Tableau Public
1 year
This #VizOfTheDay by Alexander Philipeit tracks the exact position of the sun throughout the day and across different seasons. Pro tip: You can view the solar position by various locations around the world.
Tweet media one
12
18
154
@tableaupublic
Tableau Public
4 years
Who's your favorite Star Wars character? In this #VOTD , @VizbyVarun visualizes the screen time of various characters in the sci-fi saga. Check it out:
Tweet media one
29
17
149
@tableaupublic
Tableau Public
2 years
Check out this business dashboard-style #VOTD by @ellenblackburnn who uses stacked bar charts to visualize a demo of customer support cases.
Tweet media one
8
14
150
@tableaupublic
Tableau Public
2 years
As part of the #DuBoisChallenge2022 , @menscuriosa recreated a gallery of 19 W. E. B. Du Bois' data visualizations plus a #TuskegeeAirmenChallenge viz. Check it out in this #VOTD .
Tweet media one
18
20
151
@tableaupublic
Tableau Public
3 years
Looking to freshen up your Activity Feed? Follow our latest group of Featured Authors! These data rockstars will blow you away 🤩:
26
16
151
@tableaupublic
Tableau Public
1 year
Uncover trends in website traffic and user behavior in this #VizOfTheDay by @datavizfairy , created as part of the community-led project Back 2 Viz Basics #B2VB and using Google Analytics data.
Tweet media one
12
12
146
@tableaupublic
Tableau Public
2 years
Explore this business dashboard #VizOfTheDay by @SeffanaAjaz that leverages Tableau's Superstore data set—full of information about products, sales, profits, and so on—to identify key areas for improvement within this fictitious company.
Tweet media one
10
19
148
@tableaupublic
Tableau Public
2 years
Check out this Real Word Fake Data aka #RWFD #VOTD to see how @aabattani redesigned the Tableau Call Center Accelerator, a pre-built dashboard that helps you quickly dive straight into problem-solving.
Tweet media one
20
8
147
@tableaupublic
Tableau Public
2 years
In this Real World Fake Data ( #RWFD ) #VizOfTheDay , Megan Menth shows how data from a call center can be visualized into an executive view.
Tweet media one
4
16
147
@tableaupublic
Tableau Public
5 months
Find inspiration for your next bar chart data visualization in this #VizOfTheDay by Emna HNANA. Explore these creative ways to illustrate bar charts.
Tweet media one
0
17
66
@tableaupublic
Tableau Public
2 years
Looking for extra inspiration for your #IronViz entry? Go follow our latest group of Featured Authors who have been crushing it 🔥:
16
21
146
@tableaupublic
Tableau Public
4 years
Did you know that there are nearly 80 spells in the Harry Potter books? ✨ Explore this #IronQuest #VOTD by @O_Syringa_Z to learn about each one:
Tweet media one
27
19
142
@tableaupublic
Tableau Public
2 years
Check out this retail business dashboard #VOTD by @ltavernier7 to see how he showcases data from a point of sales. P.S. He only used Tableau to create this data visualization. 📊
Tweet media one
10
12
144
@tableaupublic
Tableau Public
4 years
Working remotely has brought many shifts to one's personal and professional life. Explore this #MakeoverMonday #VOTD by Francisco Cardoso who visualized the results from a recent survey depicting some of the biggest benefits of working remotely:
Tweet media one
24
14
144
@tableaupublic
Tableau Public
4 years
Introducing our latest group of Featured Authors! These data rockstars have blown us away 🤩. Be sure to give them a follow—you won't regret it:
25
30
142
@tableaupublic
Tableau Public
4 years
Have you seen our latest group of Featured Authors?🤩They're seriously impressive! Be sure to give these data rockstars a follow on Tableau Public:
6
27
144
@tableaupublic
Tableau Public
3 years
How has your routine changed since working from home? 💻 Explore this #VOTD by @ShijiaWendy to see a comparison between her daily routines at the office versus at home:
Tweet media one
24
6
142
@tableaupublic
Tableau Public
3 years
In 2020, 37 of the Fortune 500 CEOs were women—the highest it's ever been. Explore this #VOTD by @zizzy_data to look at the diversity of Fortune 500 CEOs through the years from gender and racial perspectives:
Tweet media one
35
18
143
@tableaupublic
Tableau Public
7 years
May we have the envelope, please? The winner of the #IronViz Silver Screen is... @j_olsufka !
Tweet media one
23
46
138
@tableaupublic
Tableau Public
4 years
Will movie theaters survive the pandemic? Dive into this visualization by @_stalsh to learn about the massive drop in box office profits over the last eight months:
Tweet media one
21
10
139
@tableaupublic
Tableau Public
1 year
Tableau Public now has 3 million profiles! 🎉 Together, you've created over 7 million vizzes. Thank you to the amazing #DataFam for making this possible. Let's keep learning, creating, and sharing.
9
46
140
@tableaupublic
Tableau Public
9 months
See the health risks associated with electronic cigarettes and consumption in Brazil analyzed in this #VizOfTheDay by @PathDataFan . Explore this data viz in Portuguese or English.
Tweet media one
1
20
138
@tableaupublic
Tableau Public
2 months
Which education courses are in high demand? This #VizOfTheDay by @dat_tableau_gal showcases educational tech platform data. Explore the viz by course subjects, engagement, and pricing strategies.
Tweet media one
6
17
104
@tableaupublic
Tableau Public
3 years
🚨New feature🚨Skip installation, create vizzes straight from your browser with web authoring on Tableau Public:
7
35
138
@tableaupublic
Tableau Public
3 years
Did you know that China rents out its pandas? Today, over 60 giant pandas, native to south-central China, can be found in zoos across the world. 🐼 Explore this #VOTD by @ShijiaWendy to learn when each panda living abroad will be returned:
Tweet media one
26
6
138
@tableaupublic
Tableau Public
1 year
Where do cats go when they're not at home? Using GPS data for 925 cats in 6 countries, this #VizOfTheDay by @Rika_Olga_F visualizes their journey and the times they are most likely to go out.
Tweet media one
14
7
138
@tableaupublic
Tableau Public
3 years
Extraordinary patterns can be found everywhere. Check out this #VOTD by @BMooreWasTaken , to explore relative orbital combinations of planets within our Solar System and view the unique patterns they create over various time intervals:
Tweet media one
29
14
138
@tableaupublic
Tableau Public
3 years
Did you know that Hawaii is the most racially and ethnically diverse state in the US? Check out this #MakeOverMonday #VOTD by @menscuriosa to see how he uses waffle charts to illustrate 2019 America's racial breakdown by state.
Tweet media one
28
7
136
@tableaupublic
Tableau Public
4 years
How has our energy consumption changed over time? Explore this #VOTD created by @BMooreWasTaken for the #TheSDGVizProject to learn about the use of fossil fuels and alternative energy sources in countries around the world:
Tweet media one
32
12
135
@tableaupublic
Tableau Public
3 years
A Viz of the Day (VOTD) about #VOTD ? Yes! Check out this visualization by @WJSutton12 to see the 2,024 vizzes that have been featured throughout the years. Make sure to "star" your favorite vizzes and help contribute to a future iteration of this data:
Tweet media one
20
6
133
@tableaupublic
Tableau Public
7 months
See Flavio Matos explore the different types and elements of wine in this periodic table style #VizOfTheDay . Explore this data viz in English or Portuguese.
Tweet media one
5
22
134
@tableaupublic
Tableau Public
3 years
The cherry blossom or Sakura in Japanese is the symbolic flower of spring that paints Japan in shades of pink and white. Explore this #VOTD by @alisaprem to learn about viewing spots, blooming time and tourism of this beautiful yet brief spectacle:
Tweet media one
19
8
134
@tableaupublic
Tableau Public
6 years
Have an idea for a viz but can't find the perfect dataset? Google's new Dataset Search might be just what you need to get started! Check out the basics and get vizzin'!
0
45
129
@tableaupublic
Tableau Public
3 years
The entries for the 2021 #IronViz qualifier contest are in! 🎉 Head to our blog and explore all 320 visualizations on Data + Joy.
2
39
133
@tableaupublic
Tableau Public
3 months
Drawing inspiration from the lotus flower, @KevinWee90 's #VizOfTheDay presents the nutritional values of signature dim sum dishes alongside their Chinese names.
Tweet media one
19
9
133
@tableaupublic
Tableau Public
1 year
This #VizOfTheDay created by @im_akeelah and @fresh_gb highlights 20 ways to visualize KPIs on your business dashboards.
Tweet media one
Tweet media two
9
16
134
@tableaupublic
Tableau Public
3 years
Since 1911, #InternationalWomensDay has been a time to celebrate women's achievements and shed light on the problems that women face around the world. Dive into @s0_s0el 's #VOTD to see 51,000+ thoughts on this topic shared on Twitter this year:
Tweet media one
26
6
131
@tableaupublic
Tableau Public
5 years
Exciting news #datafam — we've just launched hashtags on Tableau Public! Now you can search and share like never before. Sign in to start tagging your vizzes and author profile:
11
47
130
@tableaupublic
Tableau Public
11 months
See @fresh_gb use a Sankey and beeswarm charts to visualize the Press Freedom Index across the globe in this #VizOfTheDay . An entry for Tableau Community projects #MakeoverMonday and #IronQuest .
Tweet media one
10
8
131
@tableaupublic
Tableau Public
3 years
The Lord of the Rings movie trilogy is considered one of the greatest cinematic achievements of our time. In this #VOTD , @GeorgeKoursaros showcases the Fellowship's journey and how much dialogue the characters had in each location:
Tweet media one
17
6
131
@tableaupublic
Tableau Public
3 years
Calling all dog lovers! You don’t want to miss this #VOTD —explore @Anjushreebv ’s latest creation to learn about the most popular dog breeds in the US:
Tweet media one
28
12
127
@tableaupublic
Tableau Public
3 years
How has the COVID-19 pandemic affected the level of crime in New York City? Explore this #VOTD by @PawanSTableau to learn about the drop in crimes reported during NYC’s quarantine period:
Tweet media one
32
6
129
@tableaupublic
Tableau Public
4 years
On April 14, 1921, it snowed 76 inches—or six feet—in Silver Lake, Colorado, setting the record for the most snowfall in one day. ❄️ Explore this #VOTD by @agatavizz to learn about record amounts of snowfall in counties across the US:
Tweet media one
21
3
128
@tableaupublic
Tableau Public
4 years
The entries for the 2020 #IronViz global qualifier contest are in! 🙌 This year, we asked you to visualize health and wellness data, and we received a record 370 submissions. Head to the blog to explore them all:
Tweet media one
4
27
128
@tableaupublic
Tableau Public
4 years
Between the years 2000 and 2005, Vogue only featured 3 Black models on their cover. In this #VOTD , @s0_s0w looks at Vogue's under-representation of Black, Indigenous, and People of Color. Learn more:
30
10
129
@tableaupublic
Tableau Public
1 year
In this #IronQuest #VizOfTheDay , Tableau Public Ambassador and 2022 Iron Viz Champion @WJSutton12 visualizes Google search autocomplete data from 2022 to analyze the most common questions for 60 popular dog breeds.
Tweet media one
14
8
128
@tableaupublic
Tableau Public
3 years
Rafael Nadal and Roger Federer are tied for the most Grand Slam titles in men’s tennis history. 🎾Dive into this #VOTD by @_CJMayes to learn about the results of every Grand Slam championship played in the last 20 years:
Tweet media one
23
6
129
@tableaupublic
Tableau Public
4 years
In the past five years, @tamasgaspar2 has completed 570 runs—totaling 5,144 kilometers! 🏃 Explore this #VOTD to see the pace, distance, and time for each one:
19
8
127
@tableaupublic
Tableau Public
4 years
Our #TableauFF this week goes to the latest group of Featured Authors! 🎉 Be sure to give each of these talented data rockstars a follow:
25
24
125
@tableaupublic
Tableau Public
4 years
AMC Theatres’ stock price is down 74% from June 1st, while Netflix’s stock price is up 27%. In this #VOTD , @flerlagekr looks at the economic impact of Coronavirus (COVID-19) on various industries. Check it out:
Tweet media one
26
19
126
@tableaupublic
Tableau Public
2 years
A step-by-step guide to building 20 different chart types. See how Tableau Public Ambassador @JtothaVizzo creatively puts together this #VOTD chart builder to help the #DataFam on their Tableau Journey.
Tweet media one
17
19
127
@tableaupublic
Tableau Public
3 years
Have you heard Fleetwood Mac's "Songbird", featured on their multi-platinum album, Rumours? 🎶 Dive into this #VOTD by @jreevers5 to explore the notes, velocity, and rhythm of this masterpiece written by vocalist Christine McVie:
Tweet media one
20
7
124
@tableaupublic
Tableau Public
3 years
Looking for extra inspiration? Our latest cohort of Featured Authors is here! Head over to our blog to meet them and don't forget to give them a follow. 😎
29
18
126
@tableaupublic
Tableau Public
11 months
Check out this #VizOfTheDay created by @ishiaki_tab who visualizes data she collected while caring for her newborn.
Tweet media one
12
20
126
@tableaupublic
Tableau Public
2 years
Explore this #ProjectHealthViz #VOTD to see how @pradeep_zen uses a dandelion chart and the mobile view feature to illustrate the most expensive sports for kids based on registration, equipment, travel, lessons, and camps expenses. 🏒
Tweet media one
23
6
126
@tableaupublic
Tableau Public
10 months
Get an overview of call center performance and how this has changed year-over-year across four key categories in this #VizOfTheDay by @ellenblackburnn .
Tweet media one
9
10
126
@tableaupublic
Tableau Public
1 year
Explore this viz collab by @SohaElghany and @MallyInData which visualizes various population indices from 2021 and 2022 of different countries around the world.
Tweet media one
8
13
125
@tableaupublic
Tableau Public
4 years
While Toronto is often referred to as the most diverse city in the world, its minority populations are primarily concentrated in low-income areas. In this #VOTD , @jrcopreros uses 2016 census data to look at income inequality across Toronto's neighborhoods:
Tweet media one
21
4
124
@tableaupublic
Tableau Public
3 years
How do you compare apples to apples to quickly spot patterns, outliers, and trends? Explore @bethkairys #VOTD to see some of her favorite ways to visualize changes when comparing current versus prior, change from prior & more. How do you like them apples?
Tweet media one
8
7
121
@tableaupublic
Tableau Public
4 years
Did you know that June 16th is International Day of Family Remittances? In this #VOTD , @marcreid visualizes the billions of dollars that migrants send home to their families. Check it out:
Tweet media one
22
11
123